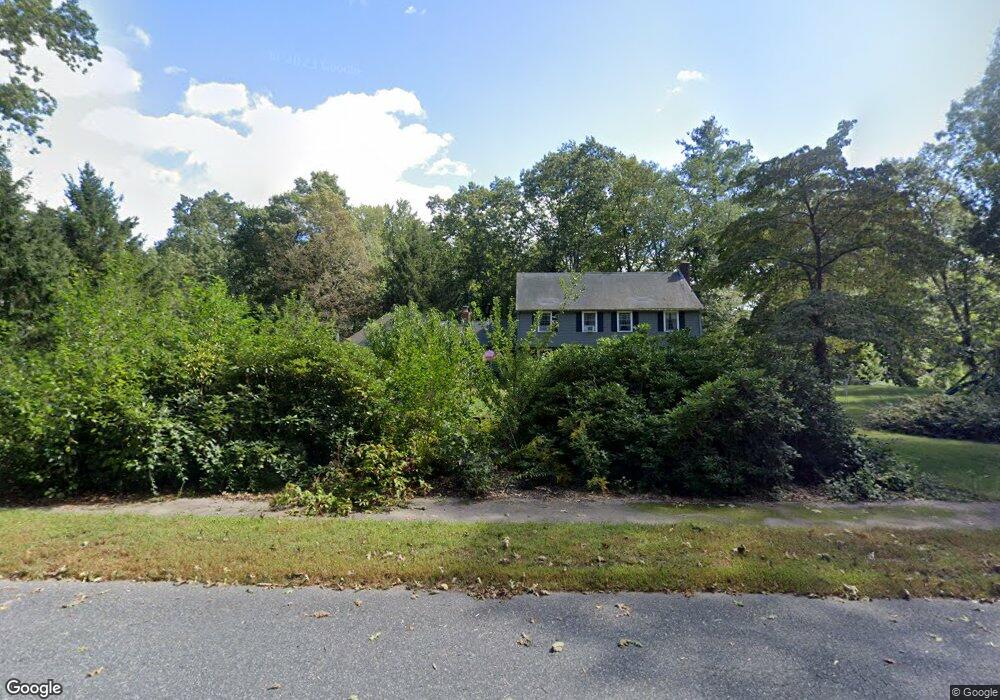
57 Ivy Ln Sherborn, MA 01770
Estimated Value: $1,342,008 - $1,390,000
4
Beds
3
Baths
3,624
Sq Ft
$377/Sq Ft
Est. Value
About This Home
This home is located at 57 Ivy Ln, Sherborn, MA 01770 and is currently estimated at $1,365,502, approximately $376 per square foot. 57 Ivy Ln is a home located in Middlesex County with nearby schools including Pine Hill Elementary School, Dover-Sherborn Regional Middle School, and Dover-Sherborn Regional High School.
Ownership History
Date
Name
Owned For
Owner Type
Purchase Details
Closed on
Nov 7, 2008
Sold by
Lodding Carole R
Bought by
Rossi Berneice and Rossi Sabin
Current Estimated Value
Home Financials for this Owner
Home Financials are based on the most recent Mortgage that was taken out on this home.
Original Mortgage
$417,000
Outstanding Balance
$273,729
Interest Rate
6.08%
Mortgage Type
Purchase Money Mortgage
Estimated Equity
$1,091,773
Create a Home Valuation Report for This Property
The Home Valuation Report is an in-depth analysis detailing your home's value as well as a comparison with similar homes in the area
Home Values in the Area
Average Home Value in this Area
Purchase History
| Date | Buyer | Sale Price | Title Company |
|---|---|---|---|
| Rossi Berneice | $740,000 | -- |
Source: Public Records
Mortgage History
| Date | Status | Borrower | Loan Amount |
|---|---|---|---|
| Open | Rossi Berneice | $417,000 |
Source: Public Records
Tax History Compared to Growth
Tax History
| Year | Tax Paid | Tax Assessment Tax Assessment Total Assessment is a certain percentage of the fair market value that is determined by local assessors to be the total taxable value of land and additions on the property. | Land | Improvement |
|---|---|---|---|---|
| 2025 | $19,702 | $1,188,300 | $451,800 | $736,500 |
| 2024 | $18,435 | $1,087,600 | $451,800 | $635,800 |
| 2023 | $16,731 | $929,000 | $451,800 | $477,200 |
| 2022 | $15,686 | $824,300 | $441,700 | $382,600 |
| 2021 | $15,604 | $794,900 | $441,700 | $353,200 |
| 2020 | $15,469 | $794,900 | $441,700 | $353,200 |
| 2019 | $4,786 | $790,400 | $441,700 | $348,700 |
| 2018 | $5,672 | $779,100 | $441,700 | $337,400 |
| 2017 | $15,020 | $734,100 | $441,700 | $292,400 |
| 2016 | $14,959 | $727,200 | $441,700 | $285,500 |
| 2015 | $14,663 | $721,600 | $436,700 | $284,900 |
| 2014 | $13,980 | $687,300 | $416,700 | $270,600 |
Source: Public Records
Map
Nearby Homes
- 2 Surrey Ln
- 14 Sewall Brook Ln
- 4 Green Ln
- 65 Farm Road Lot 6
- 18 Wildwood Dr
- 20 Nason Hill Rd
- 220 S Main St
- 32 Lake St
- 6 Brook St
- 105 N Main St
- 54 Spywood Rd
- 38 Bullard St
- 27 Spywood Rd
- 00000 S Main St and Bullard St
- 21 Spywood Rd
- 15 Wyndemere Ln
- 81 Brush Hill Rd
- 151 Mohawk Path
- 114 Farm St
- 121 Bullard St