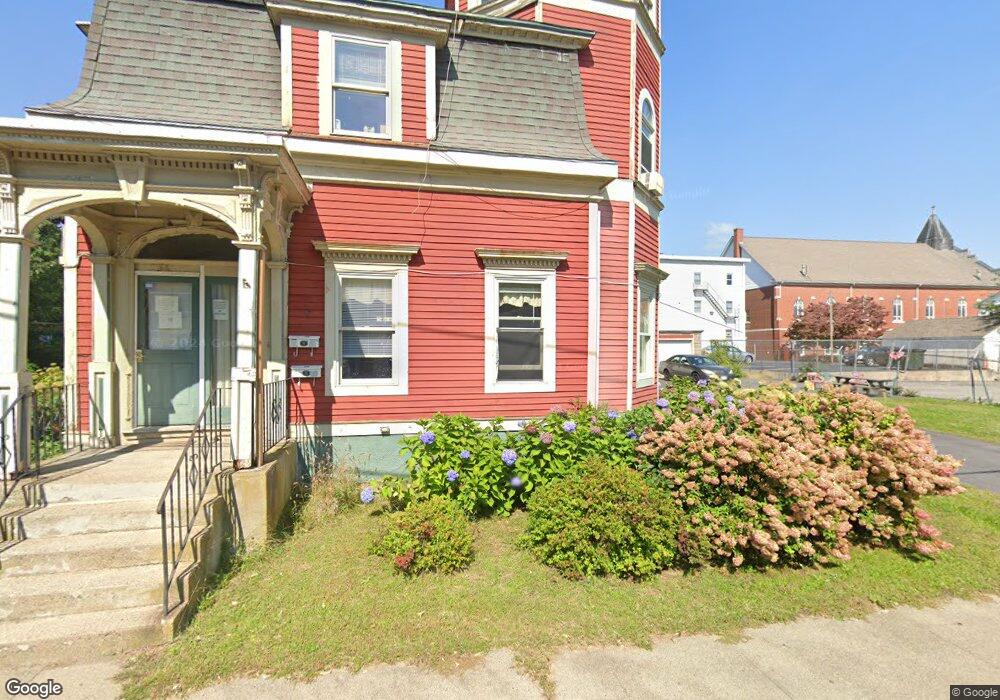
57 Jackson St Pawtucket, RI 02860
Downtown Pawtucket NeighborhoodEstimated Value: $585,000 - $647,000
7
Beds
2
Baths
2,881
Sq Ft
$214/Sq Ft
Est. Value
About This Home
This home is located at 57 Jackson St, Pawtucket, RI 02860 and is currently estimated at $616,582, approximately $214 per square foot. 57 Jackson St is a home located in Providence County with nearby schools including Central Falls Senior High School, International Charter School, and Blackstone Academy Charter School.
Ownership History
Date
Name
Owned For
Owner Type
Purchase Details
Closed on
Jun 17, 2020
Sold by
Kishkovich Oleg
Bought by
Kishkovich Oleg and Kishkovich Yelena P
Current Estimated Value
Purchase Details
Closed on
Jun 11, 2013
Sold by
Hariston Marian
Bought by
Kishkovich Oleg
Purchase Details
Closed on
Dec 21, 1998
Sold by
Mouawad Mansour
Bought by
Blackstone Vly
Create a Home Valuation Report for This Property
The Home Valuation Report is an in-depth analysis detailing your home's value as well as a comparison with similar homes in the area
Home Values in the Area
Average Home Value in this Area
Purchase History
| Date | Buyer | Sale Price | Title Company |
|---|---|---|---|
| Kishkovich Oleg | -- | None Available | |
| Kishkovich Oleg | -- | -- | |
| Blackstone Vly | $60,000 | -- |
Source: Public Records
Mortgage History
| Date | Status | Borrower | Loan Amount |
|---|---|---|---|
| Previous Owner | Blackstone Vly | $12,000 | |
| Previous Owner | Blackstone Vly | $127,000 | |
| Previous Owner | Blackstone Vly | $30,000 | |
| Previous Owner | Blackstone Vly | $85,500 |
Source: Public Records
Tax History
| Year | Tax Paid | Tax Assessment Tax Assessment Total Assessment is a certain percentage of the fair market value that is determined by local assessors to be the total taxable value of land and additions on the property. | Land | Improvement |
|---|---|---|---|---|
| 2025 | $6,391 | $486,000 | $91,200 | $394,800 |
| 2024 | $5,997 | $486,000 | $91,200 | $394,800 |
| 2023 | $5,607 | $331,000 | $39,800 | $291,200 |
| 2022 | $5,488 | $331,000 | $39,800 | $291,200 |
| 2021 | $5,488 | $331,000 | $39,800 | $291,200 |
| 2020 | $5,147 | $246,400 | $49,800 | $196,600 |
| 2019 | $5,147 | $246,400 | $49,800 | $196,600 |
| 2018 | $4,960 | $246,400 | $49,800 | $196,600 |
| 2017 | $4,655 | $204,900 | $44,100 | $160,800 |
| 2016 | $4,485 | $204,900 | $44,100 | $160,800 |
| 2015 | $4,485 | $204,900 | $44,100 | $160,800 |
| 2014 | $4,425 | $191,900 | $44,100 | $147,800 |
Source: Public Records
Map
Nearby Homes
- 256 High St
- 396 Roosevelt Ave
- 88 Barton St
- 511 High St
- 78 Barton St
- 517 High St
- 84 Barton St
- 234 Central St Unit 236
- 300 Front St Unit 105
- 300 Front St Unit 409
- 140 Dexter St
- 7 Fales St
- 30 Foundry St Unit 6
- 35 Laurel St
- 35 Rand St
- 28 Bayley St Unit 107
- 28 Bayley St Unit 301
- 153 Central Ave
- 48 Kossuth St
- 133 Cottage St
- 171 Montgomery St
- 34 Clay St Unit 36
- 38 Clay St Unit 40
- 28 Clay St Unit 6
- 28 Clay St Unit 5
- 28 Clay St
- 28 Clay St Unit 3
- 30 Clay St Unit 32
- 159 Montgomery St
- 46 Jackson St
- 42 Jackson St
- 342 High St
- 29 Barton St
- 141 Montgomery St
- 313 High St
- 39 Clay St
- 323 High St Unit 329
- 278 High St Unit 1
- 278 High St Unit 5
- 278 High St Unit 2
Your Personal Tour Guide
Ask me questions while you tour the home.