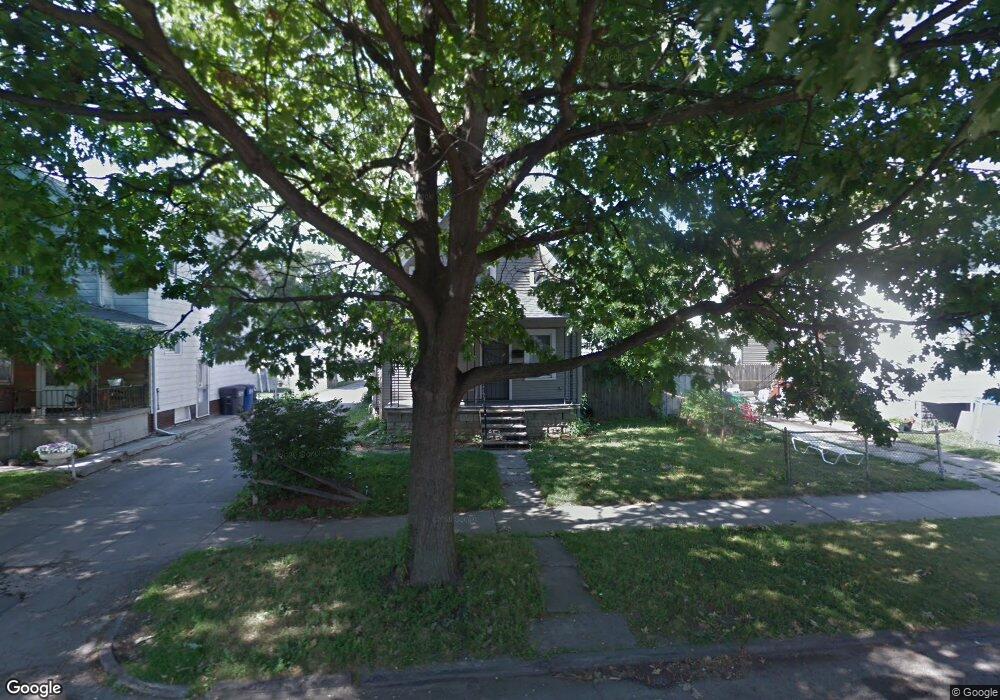
57 Jay St Toledo, OH 43605
East Toledo NeighborhoodEstimated Value: $42,000 - $67,000
3
Beds
1
Bath
1,109
Sq Ft
$49/Sq Ft
Est. Value
About This Home
This home is located at 57 Jay St, Toledo, OH 43605 and is currently estimated at $54,094, approximately $48 per square foot. 57 Jay St is a home located in Lucas County with nearby schools including Navarre Elementary School, Waite High School, and L. Hollingworth School For Talented And Gifted.
Ownership History
Date
Name
Owned For
Owner Type
Purchase Details
Closed on
Oct 4, 2022
Sold by
Greater Metropolitan Title Llc
Bought by
Weber Kurt
Current Estimated Value
Purchase Details
Closed on
Jan 23, 2009
Sold by
Kadri Raymond H and Kadri Raymond
Bought by
Greater Metropolitan Title Llc
Purchase Details
Closed on
Apr 2, 2007
Sold by
Countrywide Home Loans
Bought by
Kadri Raymond H
Purchase Details
Closed on
Apr 12, 2006
Sold by
Alsept Carolyn S and Bermejo Robert J
Bought by
Countrywide Home Loans
Purchase Details
Closed on
Nov 30, 1999
Sold by
Kadri Raymond H
Bought by
Bermejo Robert J and Alsept Carolyn S
Home Financials for this Owner
Home Financials are based on the most recent Mortgage that was taken out on this home.
Original Mortgage
$32,400
Interest Rate
8.02%
Purchase Details
Closed on
Dec 30, 1988
Sold by
Mock Luanna S
Create a Home Valuation Report for This Property
The Home Valuation Report is an in-depth analysis detailing your home's value as well as a comparison with similar homes in the area
Home Values in the Area
Average Home Value in this Area
Purchase History
| Date | Buyer | Sale Price | Title Company |
|---|---|---|---|
| Weber Kurt | $35,000 | None Listed On Document | |
| Greater Metropolitan Title Llc | -- | Metro Title Agency Inc | |
| Kadri Raymond H | $13,000 | Attorney | |
| Countrywide Home Loans | $23,334 | None Available | |
| Bermejo Robert J | $23,500 | A.R.E.A. Title Agency Inc | |
| -- | $15,000 | -- |
Source: Public Records
Mortgage History
| Date | Status | Borrower | Loan Amount |
|---|---|---|---|
| Previous Owner | Bermejo Robert J | $32,400 |
Source: Public Records
Tax History
| Year | Tax Paid | Tax Assessment Tax Assessment Total Assessment is a certain percentage of the fair market value that is determined by local assessors to be the total taxable value of land and additions on the property. | Land | Improvement |
|---|---|---|---|---|
| 2025 | -- | $9,555 | $2,905 | $6,650 |
| 2024 | $366 | $9,555 | $2,905 | $6,650 |
| 2023 | $638 | $7,735 | $3,255 | $4,480 |
| 2022 | $634 | $7,735 | $3,255 | $4,480 |
| 2021 | $638 | $7,735 | $3,255 | $4,480 |
| 2020 | $684 | $7,455 | $3,080 | $4,375 |
| 2019 | $682 | $7,455 | $3,080 | $4,375 |
| 2018 | $672 | $7,455 | $3,080 | $4,375 |
| 2017 | $694 | $7,280 | $3,010 | $4,270 |
| 2016 | $687 | $20,800 | $8,600 | $12,200 |
| 2015 | $678 | $20,800 | $8,600 | $12,200 |
| 2014 | $471 | $7,280 | $3,010 | $4,270 |
| 2013 | $471 | $7,280 | $3,010 | $4,270 |
Source: Public Records
Map
Nearby Homes
Your Personal Tour Guide
Ask me questions while you tour the home.