Estimated Value: $331,641 - $368,000
4
Beds
3
Baths
2,379
Sq Ft
$144/Sq Ft
Est. Value
About This Home
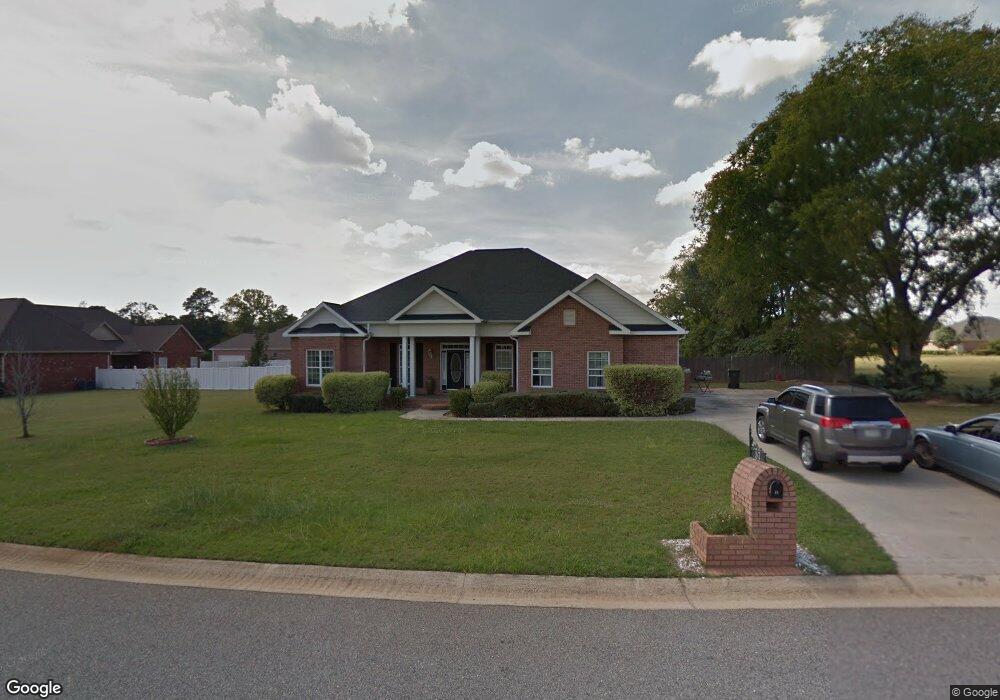
This home is located at 57 Joseph Place, Byron, GA 31008 and is currently estimated at $342,910, approximately $144 per square foot. 57 Joseph Place is a home located in Peach County with nearby schools including Kay Road Elementary School, Fort Valley Middle School, and Peach County High School.
Ownership History
Date
Name
Owned For
Owner Type
Purchase Details
Closed on
Aug 23, 2025
Sold by
Grills Arbazell
Bought by
Grills Drew and Grills Arbazelle
Current Estimated Value
Home Financials for this Owner
Home Financials are based on the most recent Mortgage that was taken out on this home.
Original Mortgage
$268,620
Outstanding Balance
$268,275
Interest Rate
6.74%
Mortgage Type
FHA
Estimated Equity
$74,635
Purchase Details
Closed on
Jul 10, 2007
Sold by
Grills Toshene C
Bought by
Grills Arbazell
Home Financials for this Owner
Home Financials are based on the most recent Mortgage that was taken out on this home.
Original Mortgage
$230,250
Interest Rate
6.71%
Mortgage Type
New Conventional
Purchase Details
Closed on
Jan 31, 2006
Sold by
Northstar Investment Inc
Bought by
Grills Toshene C
Home Financials for this Owner
Home Financials are based on the most recent Mortgage that was taken out on this home.
Original Mortgage
$143,500
Interest Rate
6.14%
Mortgage Type
New Conventional
Purchase Details
Closed on
Aug 8, 2005
Sold by
Southern Star Properties Inc
Bought by
Northstar Investments Inc
Purchase Details
Closed on
Apr 19, 1999
Bought by
Southern Star Properties Inc
Create a Home Valuation Report for This Property
The Home Valuation Report is an in-depth analysis detailing your home's value as well as a comparison with similar homes in the area
Home Values in the Area
Average Home Value in this Area
Purchase History
| Date | Buyer | Sale Price | Title Company |
|---|---|---|---|
| Grills Drew | -- | -- | |
| Grills Arbazell | $245,000 | -- | |
| Grills Toshene C | -- | -- | |
| Northstar Investments Inc | -- | -- | |
| Southern Star Properties Inc | -- | -- |
Source: Public Records
Mortgage History
| Date | Status | Borrower | Loan Amount |
|---|---|---|---|
| Open | Grills Drew | $268,620 | |
| Previous Owner | Grills Arbazell | $230,250 | |
| Previous Owner | Grills Toshene C | $143,500 | |
| Previous Owner | Grills Toshene C | $61,500 |
Source: Public Records
Tax History Compared to Growth
Tax History
| Year | Tax Paid | Tax Assessment Tax Assessment Total Assessment is a certain percentage of the fair market value that is determined by local assessors to be the total taxable value of land and additions on the property. | Land | Improvement |
|---|---|---|---|---|
| 2024 | $2,988 | $111,600 | $12,800 | $98,800 |
| 2023 | $2,942 | $108,920 | $12,800 | $96,120 |
| 2022 | $2,854 | $100,440 | $12,800 | $87,640 |
| 2021 | $2,838 | $86,360 | $12,800 | $73,560 |
| 2020 | $2,743 | $83,320 | $12,800 | $70,520 |
| 2019 | $2,755 | $83,320 | $12,800 | $70,520 |
| 2018 | $2,768 | $83,320 | $12,800 | $70,520 |
| 2017 | $2,781 | $83,320 | $12,800 | $70,520 |
| 2016 | $2,770 | $83,320 | $12,800 | $70,520 |
| 2015 | $2,987 | $90,200 | $12,800 | $77,400 |
| 2014 | $2,987 | $90,200 | $12,800 | $77,400 |
| 2013 | -- | $90,200 | $12,800 | $77,400 |
Source: Public Records
Map
Nearby Homes
- 219 Rowland Cir
- 120 Hawks Place
- 117 Hawks Ridge Trace
- 120 Hawks Ridge Trace
- 127 Hawks Ridge Trace
- 107 Red Tail Cir
- 109 Red Tail Cir
- 199 Red Tail Cir
- 152 Hawks Ridge Trace
- 0 Barker Rd Unit 243030
- 0 Barker Rd Unit 14258525
- 0 Barker Rd Unit 175053
- 555 Kimberly Dr
- 108 Early Dr
- 109 Early Dr
- 800 John E Sullivan Rd
- 211 Serenity Ct
- 24C Sterling Dr
- 111 Early Dr
- 89 Joseph Place
- 0 Joseph Place
- 24C Joseph Place
- 56 Joseph Place
- 77 Joseph Place
- 40 Joseph Place
- 21 Joseph Place
- 340 Rowland Cir
- 78 Joseph Place
- 470 Rowland Cir
- 96 Joseph Place
- 402 Rolling Acres Dr
- 330 Rowland Cir
- 88 Joseph Place
- 490 Rowland Cir
- 210 Rowland Cir
- 476 Rowland Cir
- 495 Rowland Cir
- 170 Rowland Cir
- 520 Rowland Cir