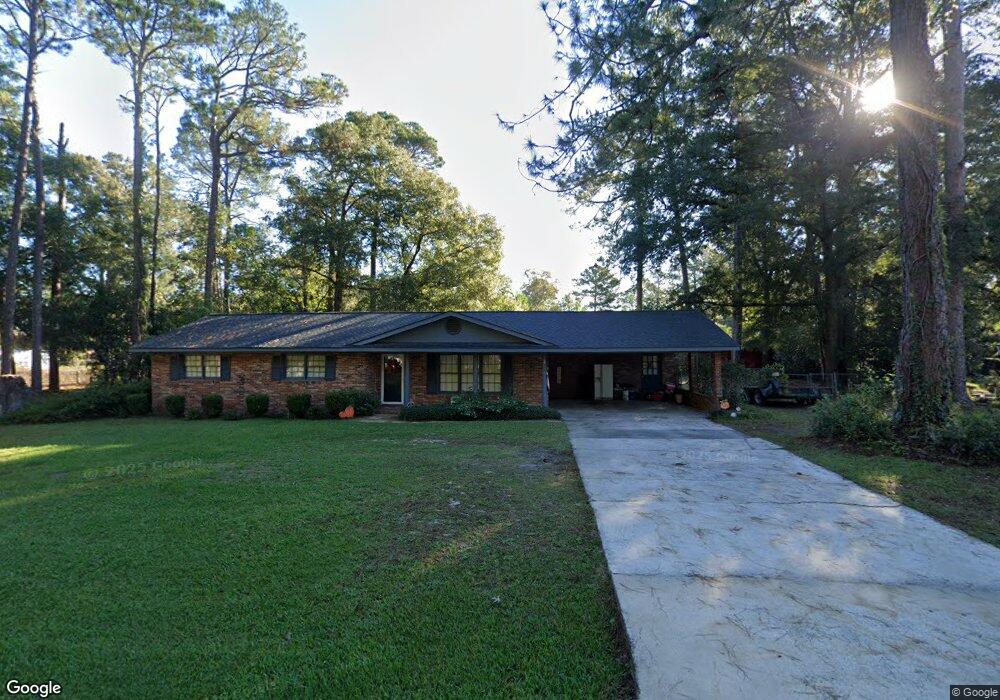
57 Libby Ave Hazlehurst, GA 31539
Estimated Value: $179,000 - $230,000
3
Beds
2
Baths
2,171
Sq Ft
$93/Sq Ft
Est. Value
About This Home
This home is located at 57 Libby Ave, Hazlehurst, GA 31539 and is currently estimated at $202,213, approximately $93 per square foot. 57 Libby Ave is a home located in Jeff Davis County with nearby schools including Jeff Davis Primary School, Jeff Davis Elementary School, and Jeff Davis Middle School.
Ownership History
Date
Name
Owned For
Owner Type
Purchase Details
Closed on
Jan 1, 2012
Sold by
Hester Constance Viola
Bought by
Doa Appraisal
Current Estimated Value
Purchase Details
Closed on
Apr 22, 2005
Sold by
Azali Jahangir
Bought by
Hester Constance Viola
Home Financials for this Owner
Home Financials are based on the most recent Mortgage that was taken out on this home.
Original Mortgage
$83,104
Interest Rate
5.99%
Mortgage Type
New Conventional
Purchase Details
Closed on
May 6, 2003
Sold by
Myatt Ronald P and Myatt Evelyn
Bought by
Azali Jahangir and Azali Rita N
Purchase Details
Closed on
Jun 8, 1999
Bought by
Myatt Ronald P and Myatt Evelyn
Purchase Details
Closed on
Feb 2, 1999
Bought by
Myatt Ronald and Evelyn Al
Purchase Details
Closed on
Jan 26, 1994
Bought by
Thompson Curtis L
Purchase Details
Closed on
Jan 1, 1983
Bought by
Mcpherson James A
Create a Home Valuation Report for This Property
The Home Valuation Report is an in-depth analysis detailing your home's value as well as a comparison with similar homes in the area
Home Values in the Area
Average Home Value in this Area
Purchase History
| Date | Buyer | Sale Price | Title Company |
|---|---|---|---|
| Doa Appraisal | $94,800 | -- | |
| Hester Constance Viola | $82,900 | -- | |
| Azali Jahangir | $77,500 | -- | |
| Myatt Ronald P | -- | -- | |
| Myatt Ronald | $85,000 | -- | |
| Thompson Curtis L | $81,500 | -- | |
| Mcpherson James A | $30,000 | -- |
Source: Public Records
Mortgage History
| Date | Status | Borrower | Loan Amount |
|---|---|---|---|
| Previous Owner | Hester Constance Viola | $83,104 |
Source: Public Records
Tax History Compared to Growth
Tax History
| Year | Tax Paid | Tax Assessment Tax Assessment Total Assessment is a certain percentage of the fair market value that is determined by local assessors to be the total taxable value of land and additions on the property. | Land | Improvement |
|---|---|---|---|---|
| 2024 | $2,603 | $71,206 | $3,000 | $68,206 |
| 2023 | $1,369 | $38,188 | $3,000 | $35,188 |
| 2022 | $1,369 | $38,188 | $3,000 | $35,188 |
| 2021 | $1,369 | $38,188 | $3,000 | $35,188 |
| 2020 | $1,369 | $38,188 | $3,000 | $35,188 |
| 2019 | $1,353 | $38,188 | $3,000 | $35,188 |
| 2018 | $1,369 | $38,188 | $3,000 | $35,188 |
| 2017 | $981 | $35,966 | $3,000 | $32,966 |
| 2016 | $931 | $34,790 | $3,000 | $31,790 |
| 2015 | -- | $34,790 | $3,000 | $31,790 |
| 2014 | -- | $34,790 | $3,000 | $31,790 |
Source: Public Records
Map
Nearby Homes
- 000 Old Graham Rd
- 00 Old Graham Rd
- 0 Old Graham Rd Unit 10531283
- 95 E Plum St
- 21 Pine St
- 58 Currie St
- 104 N Tallahassee St
- 00 N Tallahassee St
- 39 N Tallahassee St
- 142 N Tallahassee St
- 20 W Sycamore St
- 19 Martin Luther King jr Blvd
- 99 Joe Hester Rd
- 73 Latimer St
- 9 Kersey St
- 17 Young St
- 54 Walton Way
- 44 Kersey St
- 4 Lakeside Dr
- 116 Walton Way