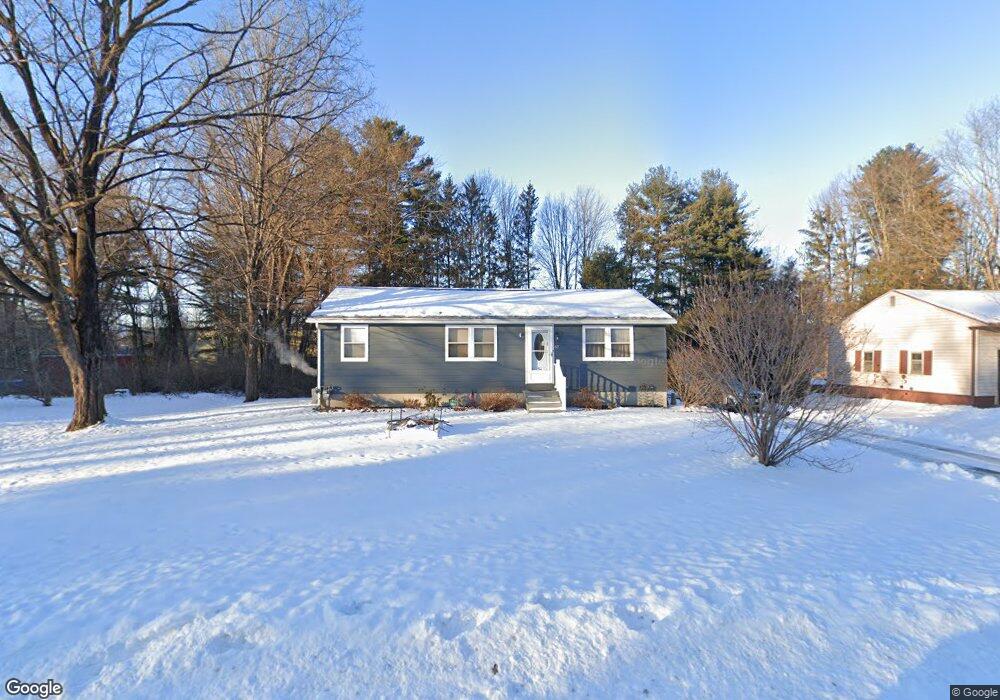
57 Mac Arthur Dr Glens Falls, NY 12801
Estimated Value: $243,000 - $270,484
3
Beds
1
Bath
984
Sq Ft
$257/Sq Ft
Est. Value
About This Home
This home is located at 57 Mac Arthur Dr, Glens Falls, NY 12801 and is currently estimated at $252,871, approximately $256 per square foot. 57 Mac Arthur Dr is a home located in Warren County with nearby schools including Glens Falls Senior High School and St. Mary-St. Alphonsus Catholic School.
Ownership History
Date
Name
Owned For
Owner Type
Purchase Details
Closed on
Dec 10, 2009
Sold by
Ingle Thomas
Bought by
Weidman Jill
Current Estimated Value
Home Financials for this Owner
Home Financials are based on the most recent Mortgage that was taken out on this home.
Original Mortgage
$144,000
Outstanding Balance
$94,502
Interest Rate
5.02%
Mortgage Type
Purchase Money Mortgage
Estimated Equity
$158,369
Purchase Details
Closed on
Dec 18, 2008
Sold by
Wells Fargo Bank
Bought by
Tidaback John
Purchase Details
Closed on
Sep 9, 2008
Sold by
Ingle Thomas
Bought by
Wells Fargo
Purchase Details
Closed on
Jan 20, 2005
Sold by
Ingle Thomas
Bought by
Ingle Thomas
Purchase Details
Closed on
Jan 31, 2002
Sold by
Hart Patricia M
Bought by
Ingle Thomas and Ingle Dianne
Purchase Details
Closed on
Jan 30, 2002
Sold by
Hart Patricia M
Bought by
Ingle Thomas and Ingle Dianne
Create a Home Valuation Report for This Property
The Home Valuation Report is an in-depth analysis detailing your home's value as well as a comparison with similar homes in the area
Home Values in the Area
Average Home Value in this Area
Purchase History
| Date | Buyer | Sale Price | Title Company |
|---|---|---|---|
| Weidman Jill | $160,500 | John Richards | |
| Tidaback John | $92,000 | Michael O'Connor | |
| Wells Fargo | $116,983 | Fein Such & Crane | |
| Ingle Thomas | -- | -- | |
| Ingle Thomas | -- | -- | |
| Ingle Thomas | $85,000 | -- |
Source: Public Records
Mortgage History
| Date | Status | Borrower | Loan Amount |
|---|---|---|---|
| Open | Weidman Jill | $144,000 |
Source: Public Records
Tax History Compared to Growth
Tax History
| Year | Tax Paid | Tax Assessment Tax Assessment Total Assessment is a certain percentage of the fair market value that is determined by local assessors to be the total taxable value of land and additions on the property. | Land | Improvement |
|---|---|---|---|---|
| 2024 | $5,092 | $183,500 | $51,500 | $132,000 |
| 2023 | $4,776 | $166,800 | $51,500 | $115,300 |
| 2022 | $4,602 | $166,800 | $51,500 | $115,300 |
| 2021 | $3,912 | $100,800 | $23,100 | $77,700 |
| 2020 | $3,890 | $100,800 | $23,100 | $77,700 |
| 2019 | $0 | $100,800 | $23,100 | $77,700 |
| 2018 | $1,841 | $100,800 | $23,100 | $77,700 |
| 2017 | $0 | $100,800 | $23,100 | $77,700 |
| 2016 | $3,675 | $100,800 | $23,100 | $77,700 |
| 2015 | -- | $100,800 | $23,100 | $77,700 |
| 2014 | -- | $100,800 | $23,100 | $77,700 |
Source: Public Records
Map
Nearby Homes
- 55 Mac Arthur Dr
- 61 Mac Arthur Dr
- 60 Mac Arthur Dr
- 49 Mac Arthur Dr
- 56 Mac Arthur Dr
- 52 Mac Arthur Dr
- 48 Mac Arthur Dr
- 23 Everts Ave
- 29 Douglas Ave
- 27 Everts Ave
- 40 Terra Cotta Ave
- 24 Everts Ave
- 31 Everts Ave
- 33 Everts Ave
- 26 Douglas Ave
- 17 Everts Ave
- 34 Terra Cotta Ave
- 28 Everts Ave
- 27 Douglas Ave
- 13 Everts Ave