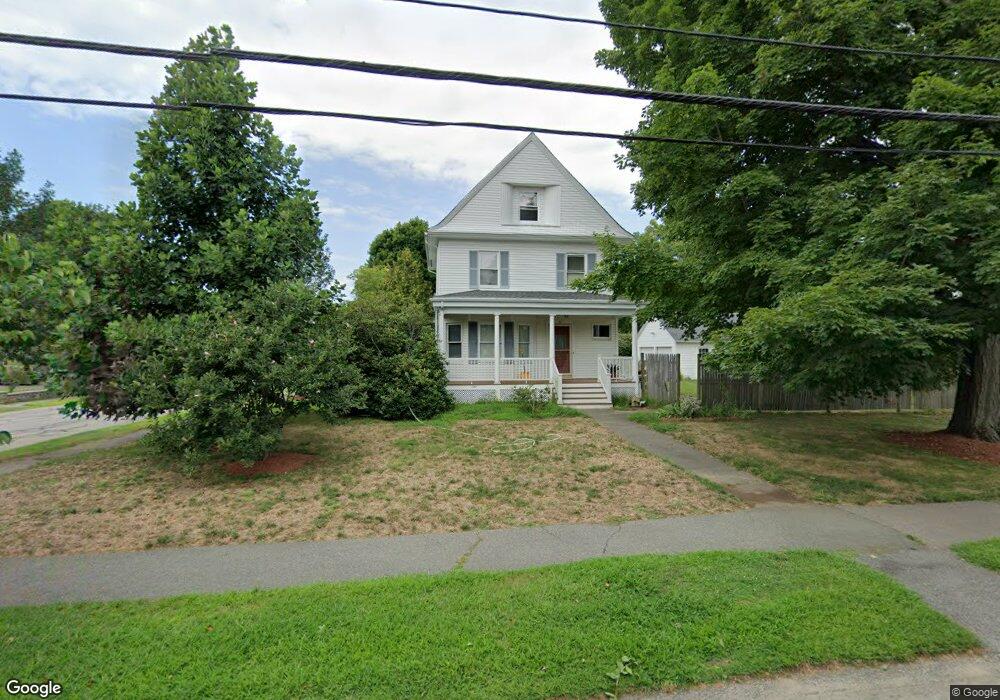
57 May St Needham, MA 02492
Estimated Value: $1,003,000 - $1,479,000
4
Beds
2
Baths
826
Sq Ft
$1,620/Sq Ft
Est. Value
About This Home
This home is located at 57 May St, Needham, MA 02492 and is currently estimated at $1,338,204, approximately $1,620 per square foot. 57 May St is a home located in Norfolk County with nearby schools including High Rock Middle School, Sunita L. Williams Elementary School, and Pollard Middle School.
Ownership History
Date
Name
Owned For
Owner Type
Purchase Details
Closed on
Jul 5, 2012
Sold by
57 May Street Props T and Chen
Bought by
Chen Amy Y
Current Estimated Value
Purchase Details
Closed on
May 17, 2011
Sold by
Chen Amy Y
Bought by
57 May Street Prop T and Chen
Purchase Details
Closed on
Oct 13, 2009
Sold by
Chen Samuel J and Chen Amy
Bought by
Chen Amy
Create a Home Valuation Report for This Property
The Home Valuation Report is an in-depth analysis detailing your home's value as well as a comparison with similar homes in the area
Home Values in the Area
Average Home Value in this Area
Purchase History
| Date | Buyer | Sale Price | Title Company |
|---|---|---|---|
| Chen Amy Y | -- | -- | |
| Chen Amy Y | -- | -- | |
| 57 May Street Prop T | -- | -- | |
| 57 May Street Prop T | -- | -- | |
| Chen Amy | -- | -- | |
| Chen Amy | -- | -- |
Source: Public Records
Mortgage History
| Date | Status | Borrower | Loan Amount |
|---|---|---|---|
| Previous Owner | Chen Amy | $160,000 | |
| Previous Owner | Chen Amy | $100,000 |
Source: Public Records
Tax History
| Year | Tax Paid | Tax Assessment Tax Assessment Total Assessment is a certain percentage of the fair market value that is determined by local assessors to be the total taxable value of land and additions on the property. | Land | Improvement |
|---|---|---|---|---|
| 2025 | $12,683 | $1,196,500 | $1,000,100 | $196,400 |
| 2024 | $10,214 | $815,800 | $581,300 | $234,500 |
| 2023 | $10,382 | $796,200 | $581,300 | $214,900 |
| 2022 | $9,989 | $747,100 | $538,300 | $208,800 |
| 2021 | $9,735 | $747,100 | $538,300 | $208,800 |
| 2020 | $8,939 | $715,700 | $538,300 | $177,400 |
| 2019 | $8,234 | $664,600 | $489,400 | $175,200 |
| 2018 | $7,895 | $664,600 | $489,400 | $175,200 |
| 2017 | $7,658 | $644,100 | $489,400 | $154,700 |
| 2016 | $7,734 | $670,200 | $489,400 | $180,800 |
| 2015 | $7,567 | $670,200 | $489,400 | $180,800 |
| 2014 | $7,018 | $602,900 | $425,600 | $177,300 |
Source: Public Records
Map
Nearby Homes
- 19 Oakland Ave Unit 19
- 19 Highland Ct Unit 19
- 638 Webster St
- 638 Webster St Unit 638
- 36 Otis St Unit 36
- 193 Garden St
- 233 Warren St
- 100 Bradford St
- 510 Webster St
- 73 Maple St Unit 1
- 58 Morton St
- 68 Pleasant St Unit 68
- 971 Webster St
- 24 Mellen St
- 190 Brookline St
- 100 Rosemary Way Unit 129
- 447 Hillside Ave
- 1011 Webster St
- 7 West St
- 90 Norfolk St
Your Personal Tour Guide
Ask me questions while you tour the home.