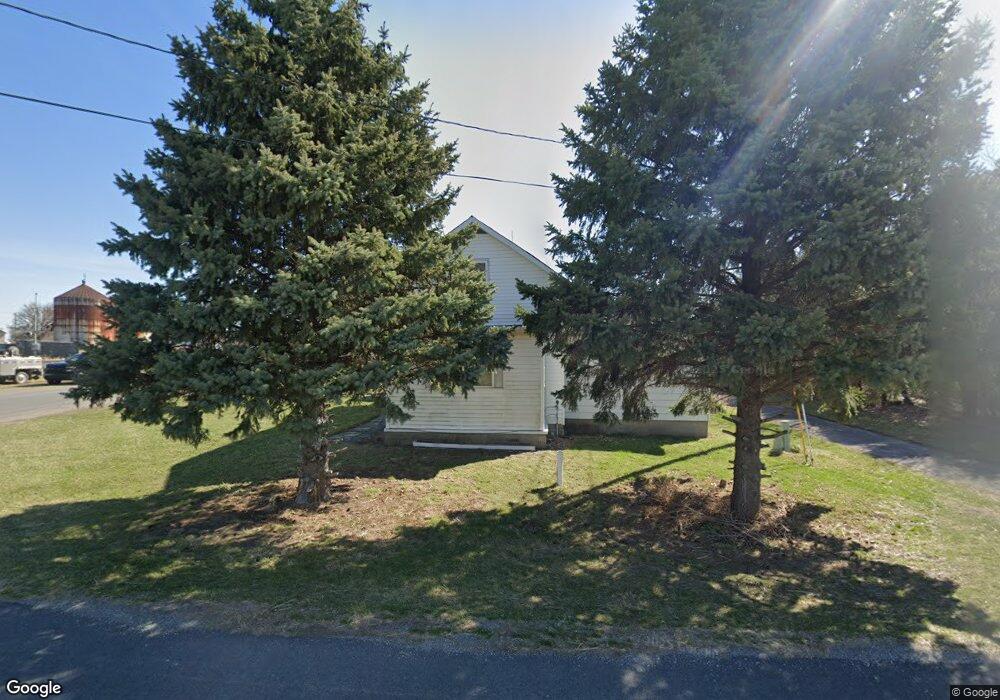
57 Mcclung St Leipsic, OH 45856
Estimated Value: $81,244 - $164,000
3
Beds
1
Bath
1,276
Sq Ft
$88/Sq Ft
Est. Value
About This Home
This home is located at 57 Mcclung St, Leipsic, OH 45856 and is currently estimated at $112,061, approximately $87 per square foot. 57 Mcclung St is a home located in Putnam County with nearby schools including Leipsic Elementary School, Leipsic High School, and St. Mary Elementary School.
Ownership History
Date
Name
Owned For
Owner Type
Purchase Details
Closed on
May 15, 2023
Sold by
Amador Rene J
Bought by
Paris Andrew L
Current Estimated Value
Home Financials for this Owner
Home Financials are based on the most recent Mortgage that was taken out on this home.
Original Mortgage
$48,500
Outstanding Balance
$46,922
Interest Rate
6.32%
Mortgage Type
New Conventional
Estimated Equity
$65,139
Purchase Details
Closed on
Jul 8, 2021
Sold by
Fort Jennings State Bank
Bought by
Amado Rene J
Purchase Details
Closed on
May 19, 2021
Sold by
Dickey Jamie M and Estate Of James D Dickey
Bought by
The Fort Jennings State Bank
Purchase Details
Closed on
Jan 25, 2008
Sold by
Estates Of Diana L Dickey
Bought by
Dickey James D
Create a Home Valuation Report for This Property
The Home Valuation Report is an in-depth analysis detailing your home's value as well as a comparison with similar homes in the area
Purchase History
| Date | Buyer | Sale Price | Title Company |
|---|---|---|---|
| Paris Andrew L | -- | None Listed On Document | |
| Amado Rene J | -- | Sahloff Kurt W | |
| The Fort Jennings State Bank | -- | None Available | |
| Dickey James D | -- | None Available |
Source: Public Records
Mortgage History
| Date | Status | Borrower | Loan Amount |
|---|---|---|---|
| Open | Paris Andrew L | $48,500 |
Source: Public Records
Tax History
| Year | Tax Paid | Tax Assessment Tax Assessment Total Assessment is a certain percentage of the fair market value that is determined by local assessors to be the total taxable value of land and additions on the property. | Land | Improvement |
|---|---|---|---|---|
| 2025 | $629 | $15,750 | $1,090 | $14,660 |
| 2024 | $641 | $15,750 | $1,090 | $14,660 |
| 2023 | $660 | $8,270 | $880 | $7,390 |
| 2022 | $435 | $8,268 | $879 | $7,389 |
| 2021 | $430 | $8,270 | $880 | $7,390 |
| 2020 | $975 | $20,200 | $880 | $19,320 |
| 2019 | $937 | $19,190 | $880 | $18,310 |
| 2018 | $908 | $19,190 | $880 | $18,310 |
| 2017 | $823 | $19,190 | $880 | $18,310 |
| 2016 | $823 | $20,200 | $880 | $19,320 |
| 2015 | $841 | $20,200 | $880 | $19,320 |
| 2014 | $808 | $20,200 | $880 | $19,320 |
| 2013 | $720 | $20,200 | $880 | $19,320 |
Source: Public Records
Map
Nearby Homes
Your Personal Tour Guide
Ask me questions while you tour the home.