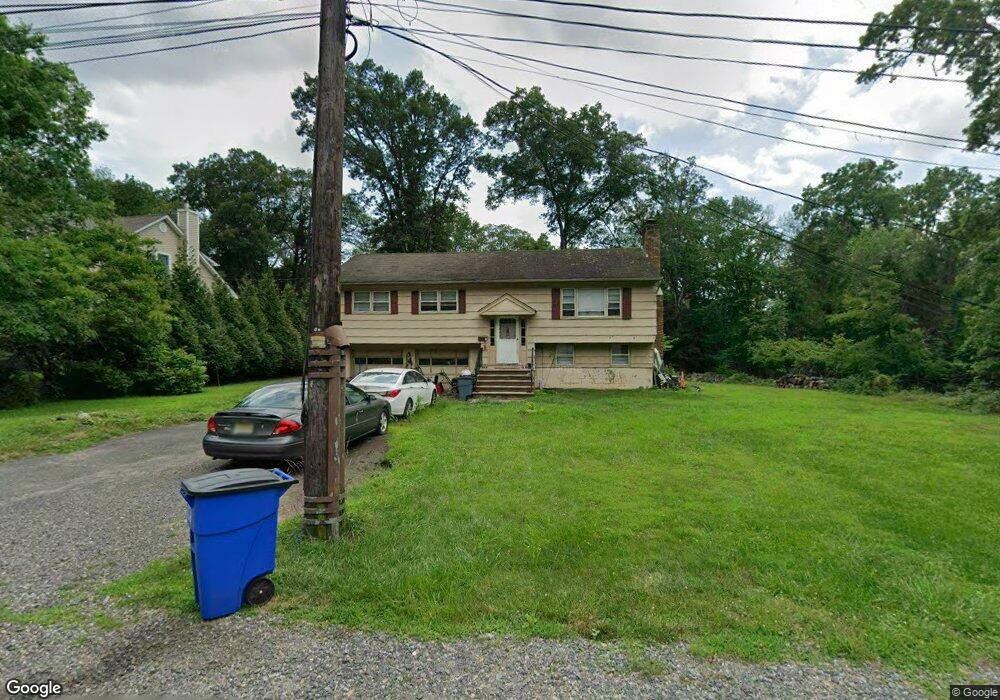
57 Meeker Ave Allendale, NJ 07401
Estimated Value: $693,000
--
Bed
--
Bath
1,748
Sq Ft
$396/Sq Ft
Est. Value
About This Home
This home is located at 57 Meeker Ave, Allendale, NJ 07401 and is currently estimated at $693,000, approximately $396 per square foot. 57 Meeker Ave is a home located in Bergen County with nearby schools including Hillside Elementary School, Brookside Elementary School, and Northern Highlands Reg High School.
Ownership History
Date
Name
Owned For
Owner Type
Purchase Details
Closed on
Nov 1, 2006
Sold by
Webber Andrea J
Current Estimated Value
Home Financials for this Owner
Home Financials are based on the most recent Mortgage that was taken out on this home.
Original Mortgage
$330,000
Outstanding Balance
$198,038
Interest Rate
6.47%
Estimated Equity
$494,962
Purchase Details
Closed on
Oct 16, 2000
Bought by
Webber Andrew J
Home Financials for this Owner
Home Financials are based on the most recent Mortgage that was taken out on this home.
Original Mortgage
$190,000
Interest Rate
7.89%
Create a Home Valuation Report for This Property
The Home Valuation Report is an in-depth analysis detailing your home's value as well as a comparison with similar homes in the area
Home Values in the Area
Average Home Value in this Area
Purchase History
| Date | Buyer | Sale Price | Title Company |
|---|---|---|---|
| -- | $530,000 | -- | |
| Webber Andrew J | -- | -- | |
| Webber Andrew J | -- | -- |
Source: Public Records
Mortgage History
| Date | Status | Borrower | Loan Amount |
|---|---|---|---|
| Open | -- | $330,000 | |
| Previous Owner | Webber Andrew J | $190,000 |
Source: Public Records
Tax History Compared to Growth
Tax History
| Year | Tax Paid | Tax Assessment Tax Assessment Total Assessment is a certain percentage of the fair market value that is determined by local assessors to be the total taxable value of land and additions on the property. | Land | Improvement |
|---|---|---|---|---|
| 2025 | $10,381 | $513,500 | $355,900 | $157,600 |
| 2024 | $10,582 | $492,200 | $343,400 | $148,800 |
| 2023 | $10,622 | $481,200 | $335,900 | $145,300 |
| 2022 | $10,622 | $466,500 | $325,900 | $140,600 |
| 2021 | $10,639 | $452,900 | $315,900 | $137,000 |
| 2020 | $10,907 | $452,000 | $310,900 | $141,100 |
| 2019 | $10,617 | $452,000 | $310,900 | $141,100 |
| 2018 | $10,382 | $452,000 | $310,900 | $141,100 |
| 2017 | $10,342 | $452,000 | $310,900 | $141,100 |
| 2016 | $10,355 | $452,000 | $310,900 | $141,100 |
| 2015 | $10,147 | $452,000 | $310,900 | $141,100 |
| 2014 | $10,602 | $444,900 | $310,900 | $134,000 |
Source: Public Records
Map
Nearby Homes
- 3 Anne Ave
- 2 Allison Ct Unit C0002
- 17 Allison Ct
- 77 Myrtle Ave
- 193 S Franklin Turnpike
- 65 Lakeside Dr
- 10 Biscayne Dr
- 6 Cottage Place
- 65 Park Ave
- 356 E Allendale Ave
- 132 Prospect St
- 45 W Orchard St
- 8 Oratam Rd
- 5 Joseph Ct
- 8 Garden Ct
- 10 E Allendale Rd
- 90 Arcadia Rd
- 48 Lake St
- 14 Mechanic St
- 24 Vanderbeck Ln