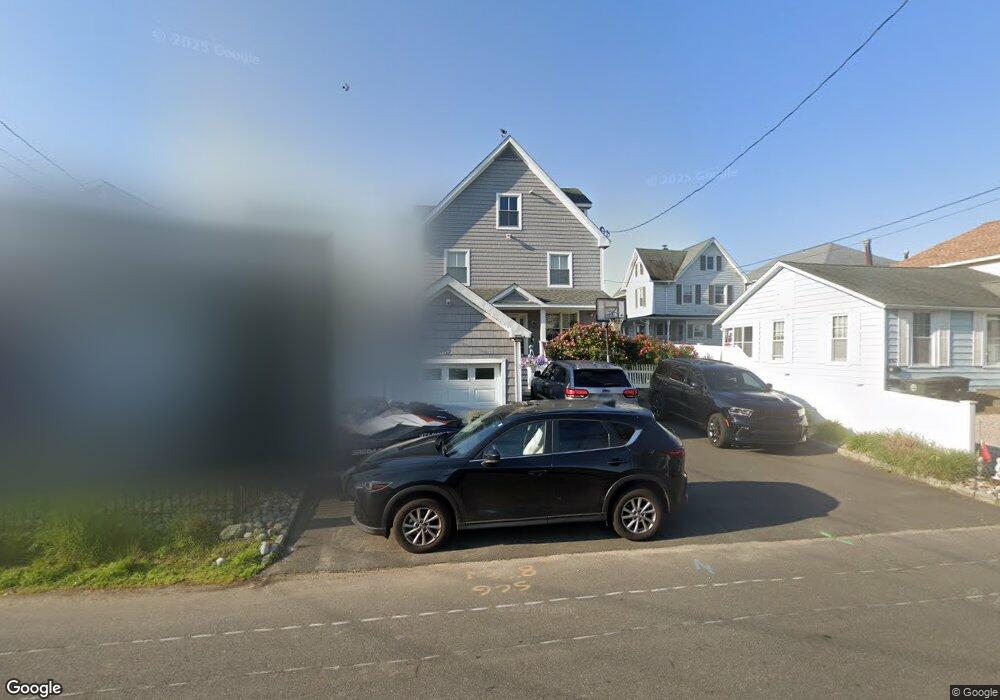
57 Melba St Milford, CT 06460
East Milford NeighborhoodEstimated Value: $785,000 - $1,465,000
5
Beds
4
Baths
3,475
Sq Ft
$336/Sq Ft
Est. Value
About This Home
This home is located at 57 Melba St, Milford, CT 06460 and is currently estimated at $1,168,871, approximately $336 per square foot. 57 Melba St is a home located in New Haven County with nearby schools including Calf Pen Meadow Elementary School, East Shore Middle School, and Joseph A. Foran High School.
Ownership History
Date
Name
Owned For
Owner Type
Purchase Details
Closed on
Oct 6, 2025
Sold by
Ganim George W
Bought by
George W Ganim Jr T W and George Ganim
Current Estimated Value
Purchase Details
Closed on
Apr 4, 2023
Sold by
Ganim George W
Bought by
Geirge W Ganim Jr Ret and Ganim
Purchase Details
Closed on
Feb 10, 2023
Sold by
George W Ganim Jr Ret and Ganim
Bought by
Ganim George
Purchase Details
Closed on
Oct 15, 2019
Sold by
Ganim George W
Bought by
George W Ganim Jr Ret and Ganim
Purchase Details
Closed on
Apr 23, 1993
Sold by
Lawrence Daniel D
Bought by
Ganim George W
Create a Home Valuation Report for This Property
The Home Valuation Report is an in-depth analysis detailing your home's value as well as a comparison with similar homes in the area
Home Values in the Area
Average Home Value in this Area
Purchase History
| Date | Buyer | Sale Price | Title Company |
|---|---|---|---|
| George W Ganim Jr T W | -- | -- | |
| Geirge W Ganim Jr Ret | -- | None Available | |
| Geirge W Ganim Jr Ret | -- | None Available | |
| Ganim George | -- | None Available | |
| Ganim George | -- | None Available | |
| George W Ganim Jr Ret | -- | None Available | |
| George W Ganim Jr Ret | -- | None Available | |
| Ganim George W | $285,000 | -- | |
| Ganim George W | $285,000 | -- |
Source: Public Records
Mortgage History
| Date | Status | Borrower | Loan Amount |
|---|---|---|---|
| Previous Owner | Ganim George W | $250,000 | |
| Previous Owner | Ganim George W | $250,000 | |
| Previous Owner | Ganim George W | $190,000 |
Source: Public Records
Tax History
| Year | Tax Paid | Tax Assessment Tax Assessment Total Assessment is a certain percentage of the fair market value that is determined by local assessors to be the total taxable value of land and additions on the property. | Land | Improvement |
|---|---|---|---|---|
| 2025 | $18,416 | $623,200 | $344,400 | $278,800 |
| 2024 | $18,160 | $623,200 | $344,400 | $278,800 |
| 2023 | $16,932 | $623,200 | $344,400 | $278,800 |
| 2022 | $16,608 | $623,200 | $344,400 | $278,800 |
| 2021 | $13,741 | $496,950 | $252,000 | $244,950 |
| 2020 | $13,756 | $496,950 | $252,000 | $244,950 |
| 2019 | $13,770 | $496,950 | $252,000 | $244,950 |
| 2018 | $13,785 | $496,950 | $252,000 | $244,950 |
| 2017 | $13,812 | $497,000 | $252,000 | $245,000 |
| 2016 | $14,096 | $506,330 | $280,000 | $226,330 |
| 2015 | $14,116 | $506,330 | $280,000 | $226,330 |
| 2014 | $13,782 | $506,330 | $280,000 | $226,330 |
Source: Public Records
Map
Nearby Homes
- 44 Beachland Ave
- 25 Summer Place
- 43 Beachland Ave
- 7 Orland St
- 42 Melba St
- 44 Chester St
- 74 Platt St
- 71 Platt St
- 56 Carriage Path S Unit 56
- 36 Carriage Dr
- 40 Carriage Path N
- 10 Point Beach Dr
- 38 Elaine Rd
- 51 Point Beach Dr
- 35 Point Lookout
- 234 Pond Point Ave
- 35 Hilltop Cir E
- 20 Dorothy St
- 125 Ridgewood Dr
- 590 Gulf St
Your Personal Tour Guide
Ask me questions while you tour the home.