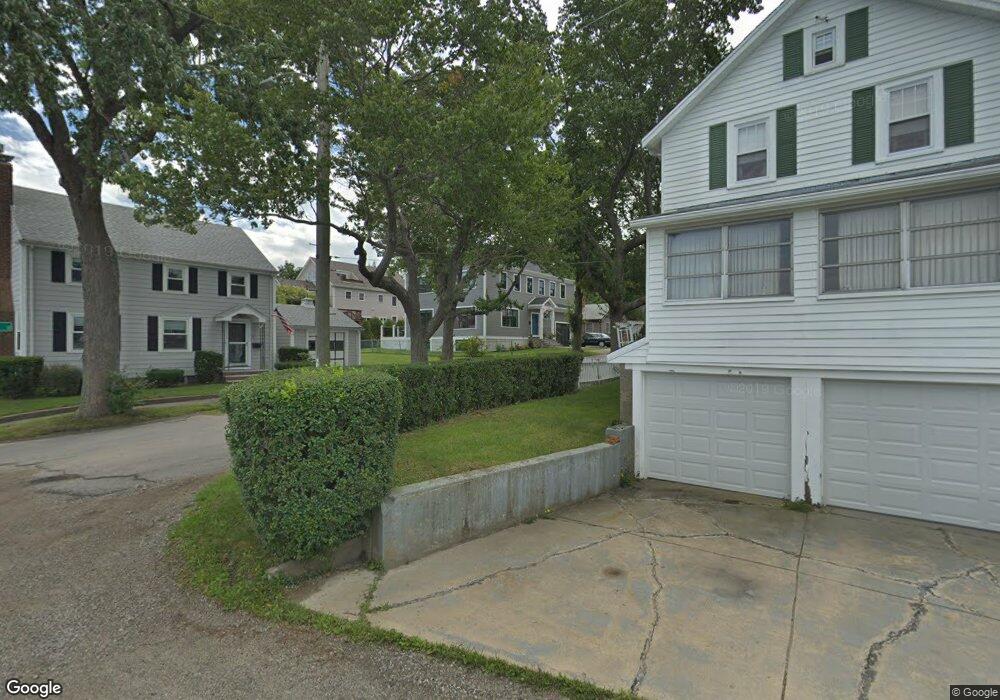
57 Middlesex St Quincy, MA 02171
Squantum NeighborhoodEstimated Value: $1,377,000 - $1,488,000
4
Beds
3
Baths
3,048
Sq Ft
$471/Sq Ft
Est. Value
About This Home
This home is located at 57 Middlesex St, Quincy, MA 02171 and is currently estimated at $1,435,864, approximately $471 per square foot. 57 Middlesex St is a home located in Norfolk County with nearby schools including Squantum Elementary School, Atlantic Middle School, and North Quincy High School.
Ownership History
Date
Name
Owned For
Owner Type
Purchase Details
Closed on
Sep 24, 2013
Sold by
Monteagudo Paul L and Monteagudo Stephanie L
Bought by
Monteagudo Paul L and Monteagudo Stephanie L
Current Estimated Value
Home Financials for this Owner
Home Financials are based on the most recent Mortgage that was taken out on this home.
Original Mortgage
$295,100
Outstanding Balance
$221,054
Interest Rate
4.42%
Mortgage Type
New Conventional
Estimated Equity
$1,214,810
Purchase Details
Closed on
Jun 25, 1998
Sold by
Calnan Sean M and Calnan Annemarie A
Bought by
Montegudo Paul L and Montegudo Julie A
Home Financials for this Owner
Home Financials are based on the most recent Mortgage that was taken out on this home.
Original Mortgage
$222,300
Interest Rate
7.09%
Mortgage Type
Purchase Money Mortgage
Purchase Details
Closed on
Jan 5, 1993
Sold by
Macmillan Richard K and Macmillan Teri L
Bought by
Calnan Sean M and Calnan Annemaire A
Create a Home Valuation Report for This Property
The Home Valuation Report is an in-depth analysis detailing your home's value as well as a comparison with similar homes in the area
Home Values in the Area
Average Home Value in this Area
Purchase History
| Date | Buyer | Sale Price | Title Company |
|---|---|---|---|
| Monteagudo Paul L | -- | -- | |
| Monteagudo Paul L | -- | -- | |
| Montegudo Paul L | $247,000 | -- | |
| Calnan Sean M | $172,500 | -- |
Source: Public Records
Mortgage History
| Date | Status | Borrower | Loan Amount |
|---|---|---|---|
| Open | Calnan Sean M | $295,100 | |
| Previous Owner | Calnan Sean M | $222,300 | |
| Previous Owner | Calnan Sean M | $165,000 |
Source: Public Records
Tax History
| Year | Tax Paid | Tax Assessment Tax Assessment Total Assessment is a certain percentage of the fair market value that is determined by local assessors to be the total taxable value of land and additions on the property. | Land | Improvement |
|---|---|---|---|---|
| 2025 | $14,196 | $1,231,200 | $434,500 | $796,700 |
| 2024 | $13,460 | $1,194,300 | $413,800 | $780,500 |
| 2023 | $12,459 | $1,119,400 | $394,100 | $725,300 |
| 2022 | $12,726 | $1,062,300 | $344,000 | $718,300 |
| 2021 | $12,508 | $1,030,300 | $344,000 | $686,300 |
| 2020 | $12,145 | $977,100 | $312,800 | $664,300 |
| 2019 | $12,039 | $959,300 | $326,900 | $632,400 |
| 2018 | $6,683 | $501,000 | $325,000 | $176,000 |
| 2017 | $5,784 | $408,200 | $235,500 | $172,700 |
| 2016 | $5,263 | $366,500 | $214,100 | $152,400 |
| 2015 | $5,165 | $353,800 | $214,100 | $139,700 |
| 2014 | $5,038 | $339,000 | $214,100 | $124,900 |
Source: Public Records
Map
Nearby Homes
- 130 Parke Ave (Lot 2)
- 156 Parke Ave
- 1 Parke Ave
- 865 E Squantum St
- 19 Harbourside Rd Unit 19
- 21 Harbourside Rd Unit 26
- 1001 Marina Dr Unit 705
- 1001 Marina Dr Unit 708
- 1001 Marina Dr Unit 213
- 100 Marina Dr Unit 615
- 100 Marina Dr Unit 306
- 2001 Marina Dr Unit 506W
- 2001 Marina Dr Unit 211
- 10 Seaport Dr Unit 2505
- 10 Seaport Dr Unit 2311
- 10 Seaport Dr Unit 2213
- 297 Billings St
- 271 Atlantic St
- 212 Quincy Shore Dr
- 201 Billings St
- 55 Middlesex St
- 60 Gladstone St
- 67 Middlesex St
- 54 Gladstone St
- 70 Gladstone St
- 58 Middlesex St
- 66 Middlesex St
- 66 Middlesex St Unit 1
- 54 Middlesex St
- 47 Middlesex St
- 50 Gladstone St
- 85 Bayside Rd
- 63 Bayside Rd
- 44 Middlesex St
- 57 Wedgewood St
- 46 Gladstone St
- 57 Gladstone St
- 61 Wedgewood St
- 65 Gladstone St
- 53 Gladstone St
Your Personal Tour Guide
Ask me questions while you tour the home.