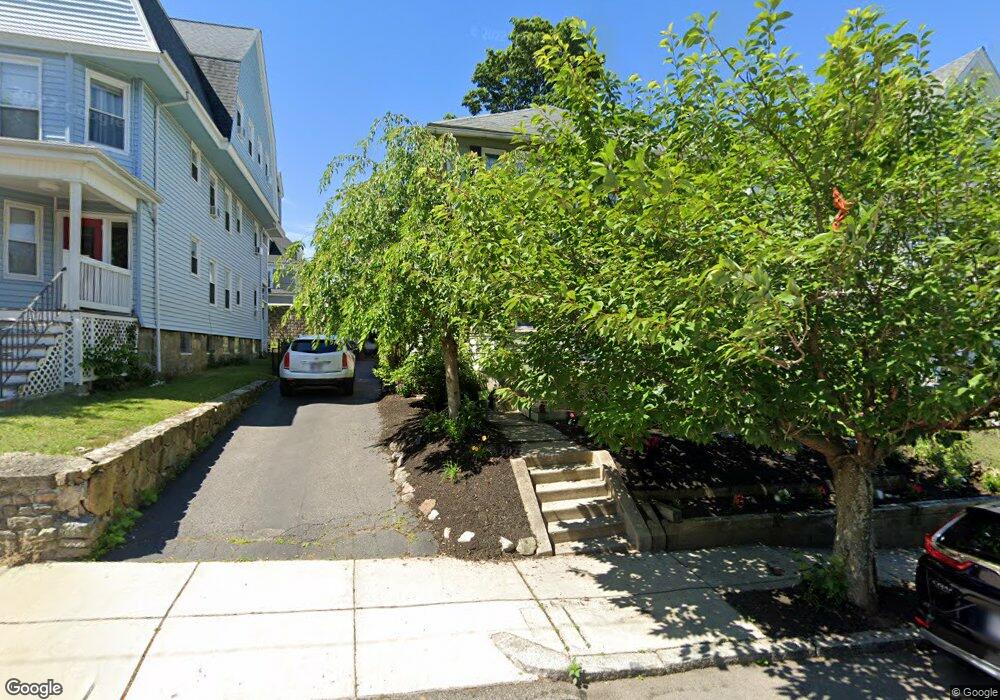
57 Montvale St Roslindale, MA 02131
Roslindale NeighborhoodEstimated Value: $930,000 - $1,047,215
4
Beds
2
Baths
2,141
Sq Ft
$465/Sq Ft
Est. Value
About This Home
This home is located at 57 Montvale St, Roslindale, MA 02131 and is currently estimated at $995,804, approximately $465 per square foot. 57 Montvale St is a home located in Suffolk County with nearby schools including Holy Name Parish School and The Roxbury Latin School.
Ownership History
Date
Name
Owned For
Owner Type
Purchase Details
Closed on
May 8, 2000
Sold by
Deraney Patricia M Est
Bought by
Oconnell Brian M and Oconnell Tonya L
Current Estimated Value
Home Financials for this Owner
Home Financials are based on the most recent Mortgage that was taken out on this home.
Original Mortgage
$314,650
Outstanding Balance
$109,250
Interest Rate
8.21%
Mortgage Type
Purchase Money Mortgage
Estimated Equity
$886,554
Create a Home Valuation Report for This Property
The Home Valuation Report is an in-depth analysis detailing your home's value as well as a comparison with similar homes in the area
Home Values in the Area
Average Home Value in this Area
Purchase History
| Date | Buyer | Sale Price | Title Company |
|---|---|---|---|
| Oconnell Brian M | $350,000 | -- |
Source: Public Records
Mortgage History
| Date | Status | Borrower | Loan Amount |
|---|---|---|---|
| Open | Oconnell Brian M | $314,650 |
Source: Public Records
Tax History Compared to Growth
Tax History
| Year | Tax Paid | Tax Assessment Tax Assessment Total Assessment is a certain percentage of the fair market value that is determined by local assessors to be the total taxable value of land and additions on the property. | Land | Improvement |
|---|---|---|---|---|
| 2025 | $10,723 | $926,000 | $307,800 | $618,200 |
| 2024 | $9,584 | $879,300 | $282,500 | $596,800 |
| 2023 | $8,909 | $829,500 | $266,500 | $563,000 |
| 2022 | $8,276 | $760,700 | $244,400 | $516,300 |
| 2021 | $7,805 | $731,500 | $235,000 | $496,500 |
| 2020 | $6,925 | $655,800 | $217,900 | $437,900 |
| 2019 | $6,513 | $617,900 | $178,800 | $439,100 |
| 2018 | $5,888 | $561,800 | $178,800 | $383,000 |
| 2017 | $5,890 | $556,200 | $178,800 | $377,400 |
| 2016 | $5,612 | $510,200 | $178,800 | $331,400 |
| 2015 | $5,033 | $415,600 | $150,100 | $265,500 |
| 2014 | $5,075 | $403,400 | $150,100 | $253,300 |
Source: Public Records
Map
Nearby Homes
- 37 Montvale St Unit 2
- 311 Belgrade Ave
- 59 Aldrich St Unit 2
- 95 Newburg St
- 150 Aldrich St
- 43 Aldrich St
- 257 Belgrade Ave
- 242 Belgrade Ave
- 1690 Centre St Unit 2
- 40 Newburg St Unit 1
- 416 Belgrade Ave Unit 25
- 104 Stratford St
- 15 Newburg St Unit 1
- 105 Orange St
- 43 Ainsworth St Unit 2
- 15 White Oak Rd
- 276 Cornell St
- 69 Bradfield Ave Unit 1
- 72 Theodore Parker Rd
- 1540 Centre St Unit 1
- 57 Montvale St Unit 1
- 53 Montvale St
- 53 Montvale St Unit 1
- 61 Montvale St
- 49 Montvale St Unit 1
- 49 Montvale St
- 49 Montvale St Unit 2
- 40 Lorraine St
- 65 Montvale St
- 44 Lorraine St
- 36 Lorraine St
- 36 Lorraine St
- 36 Lorraine St Unit 2
- 36 Lorraine St Unit 1
- 32 Lorraine St
- 32 Lorraine St Unit 3
- 48 Lorraine St
- 56 Montvale St
- 56 Montvale St Unit 2
- 56 Montvale St Unit 3