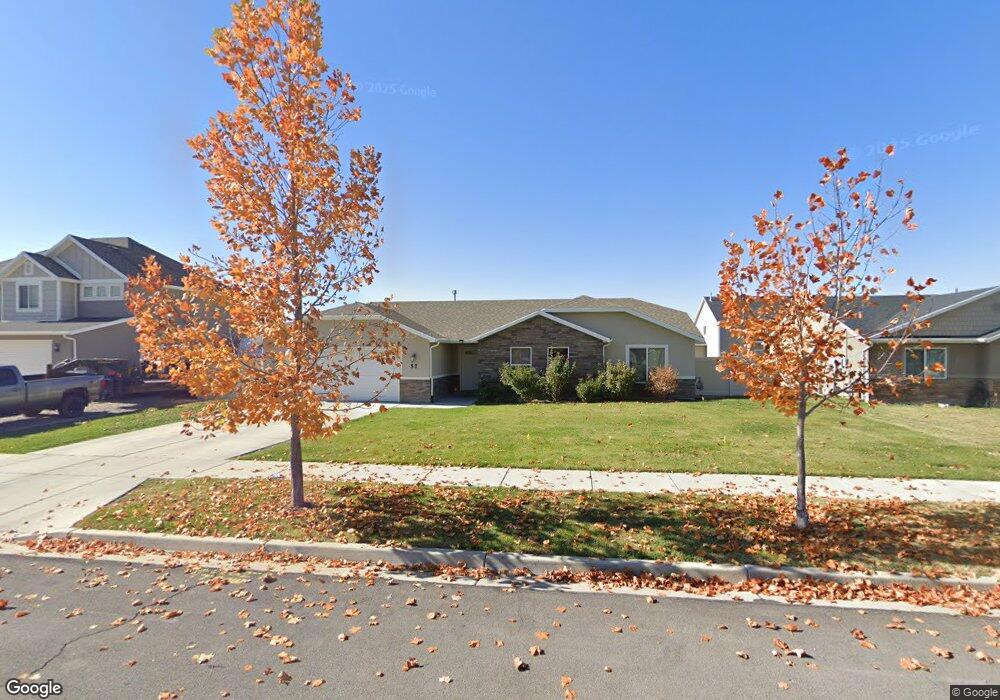
57 N 450 W Unit 21 Springville, UT 84663
Westfields North NeighborhoodEstimated Value: $495,000 - $533,465
3
Beds
2
Baths
1,571
Sq Ft
$324/Sq Ft
Est. Value
About This Home
This home is located at 57 N 450 W Unit 21, Springville, UT 84663 and is currently estimated at $508,822, approximately $323 per square foot. 57 N 450 W Unit 21 is a home located in Utah County with nearby schools including Westside Elementary School, Springville Junior High School, and Springville High School.
Ownership History
Date
Name
Owned For
Owner Type
Purchase Details
Closed on
Sep 13, 2017
Sold by
Harrison Melody
Bought by
Miranda Gonzalo Hernandez and Andrade Teresa Ruiz
Current Estimated Value
Home Financials for this Owner
Home Financials are based on the most recent Mortgage that was taken out on this home.
Original Mortgage
$260,101
Outstanding Balance
$217,203
Interest Rate
3.9%
Mortgage Type
FHA
Estimated Equity
$291,619
Purchase Details
Closed on
Dec 1, 2014
Sold by
Payne Wade
Bought by
Harrison Jonathan W and Harrison Melody
Home Financials for this Owner
Home Financials are based on the most recent Mortgage that was taken out on this home.
Original Mortgage
$213,560
Interest Rate
3.75%
Mortgage Type
FHA
Purchase Details
Closed on
May 7, 2013
Sold by
Perry Jack and Perry Suzanna
Bought by
Payne Wade
Create a Home Valuation Report for This Property
The Home Valuation Report is an in-depth analysis detailing your home's value as well as a comparison with similar homes in the area
Home Values in the Area
Average Home Value in this Area
Purchase History
| Date | Buyer | Sale Price | Title Company |
|---|---|---|---|
| Miranda Gonzalo Hernandez | -- | Us Title Insurance Agency | |
| Harrison Jonathan W | -- | Atlas Title | |
| Payne Wade | -- | Atlas Title |
Source: Public Records
Mortgage History
| Date | Status | Borrower | Loan Amount |
|---|---|---|---|
| Open | Miranda Gonzalo Hernandez | $260,101 | |
| Previous Owner | Harrison Jonathan W | $213,560 |
Source: Public Records
Tax History
| Year | Tax Paid | Tax Assessment Tax Assessment Total Assessment is a certain percentage of the fair market value that is determined by local assessors to be the total taxable value of land and additions on the property. | Land | Improvement |
|---|---|---|---|---|
| 2025 | $2,493 | $268,565 | -- | -- |
| 2024 | $2,493 | $247,445 | $0 | $0 |
| 2023 | $2,443 | $244,695 | $0 | $0 |
| 2022 | $2,669 | $262,570 | $0 | $0 |
| 2021 | $2,269 | $347,100 | $130,700 | $216,400 |
| 2020 | $2,112 | $313,200 | $96,800 | $216,400 |
| 2019 | $2,003 | $302,000 | $93,200 | $208,800 |
| 2018 | $1,879 | $270,100 | $87,300 | $182,800 |
| 2017 | $1,687 | $128,700 | $0 | $0 |
| 2016 | $1,629 | $121,715 | $0 | $0 |
| 2015 | $1,487 | $113,300 | $0 | $0 |
| 2014 | $703 | $53,100 | $0 | $0 |
Source: Public Records
Map
Nearby Homes
Your Personal Tour Guide
Ask me questions while you tour the home.