Estimated payment $1,470/month
Highlights
- No HOA
- Forced Air Heating System
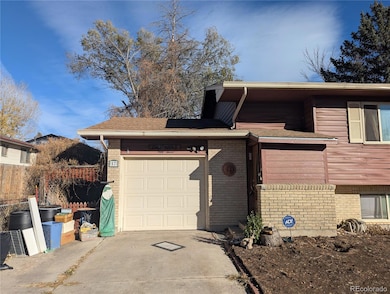
- Partially Fenced Property
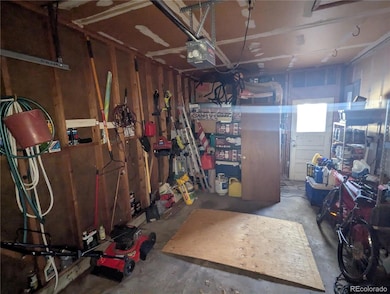
- 1 Car Attached Garage
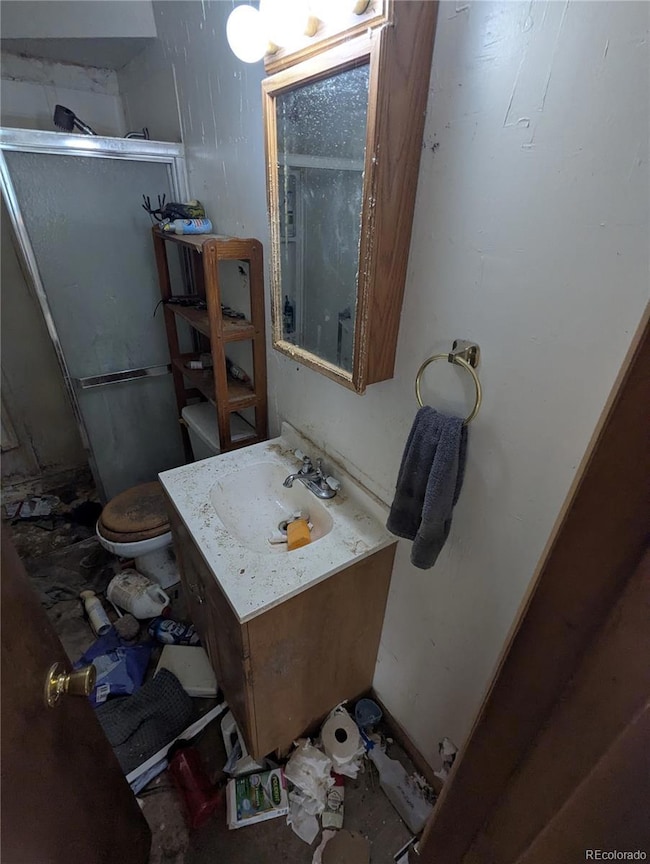
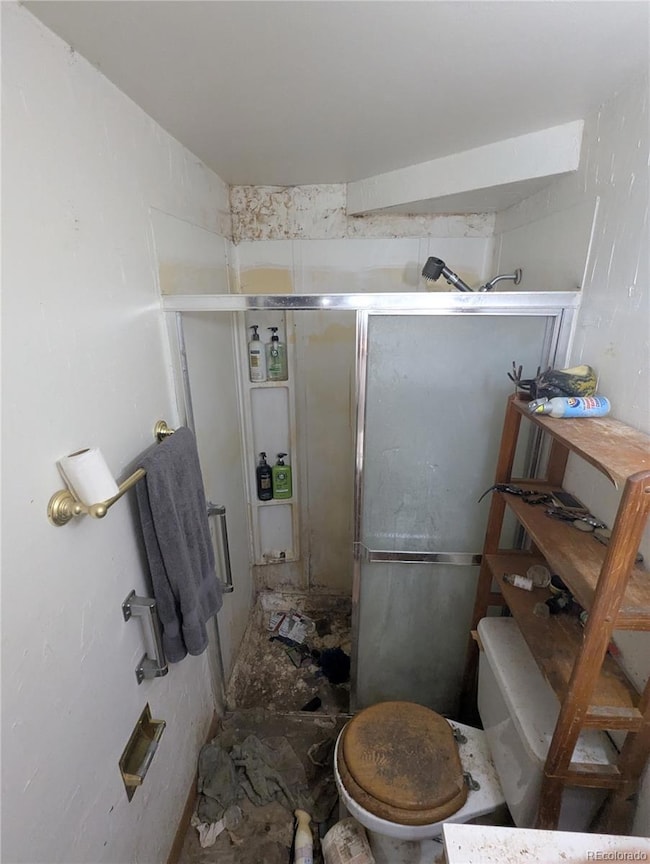
About This Home
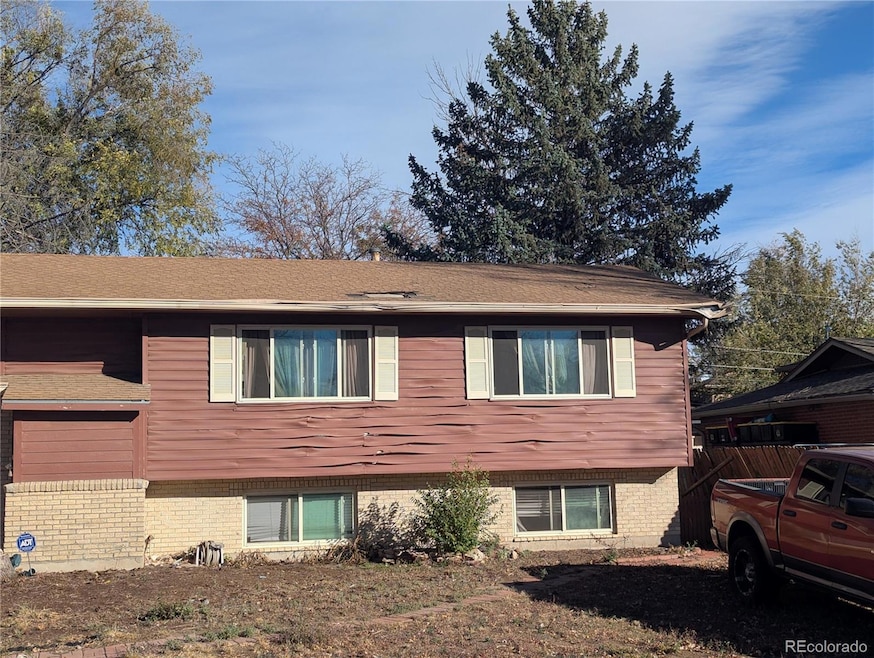
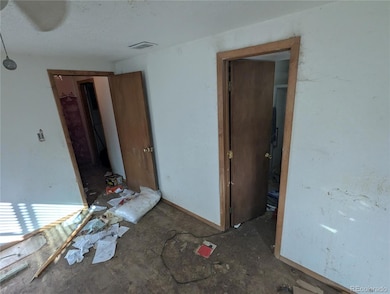
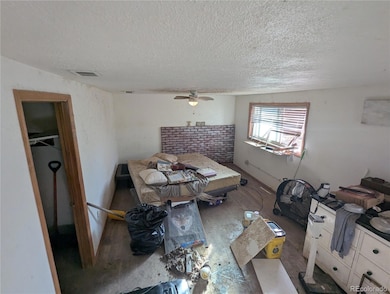
This fixer-upper is brimming with potential for investors and handy homeowners alike. If you’re not afraid to roll up your sleeves, this property could be your next great project. With a solid bones and a generous layout, the possibilities are endless. Bring your tools and creativity to breathe new life into this home and unlock its full value by gaining instant equity. Whether you plan to renovate and flip for profit or hold as a rental to build long-term wealth, this is an opportunity that’s hard to come by in today’s market. With a little vision and effort, this diamond in the rough can shine once again, don’t miss your chance to make it happen.
Listing Agent
Atlas Real Estate Group Brokerage Email: chrismferri@gmail.com,720-980-0831 License #100096093 Listed on: 11/07/2025
Home Details
Home Type
- Single Family
Est. Annual Taxes
- $887
Year Built
- Built in 1966
Lot Details
- 6,534 Sq Ft Lot
- Partially Fenced Property
- Property is zoned RS-5000 CA
Parking
- 1 Car Attached Garage
Home Design
- Fixer Upper
- Frame Construction
- Composition Roof
Interior Spaces
- Multi-Level Property
- Partial Basement
Bedrooms and Bathrooms
- 2 Full Bathrooms
Schools
- Widefield Elementary School
- Grand Mountain Middle School
- Widefield High School
Utilities
- No Cooling
- Forced Air Heating System
- Cable TV Available
Community Details
- No Home Owners Association
- Widefield Heights Fil 5 Subdivision
Listing and Financial Details
- Exclusions: Seller's personal property.
- Assessor Parcel Number 65134-20-003
Map
Home Values in the Area
Average Home Value in this Area
Tax History
| Year | Tax Paid | Tax Assessment Tax Assessment Total Assessment is a certain percentage of the fair market value that is determined by local assessors to be the total taxable value of land and additions on the property. | Land | Improvement |
|---|---|---|---|---|
| 2025 | $1,366 | $23,320 | -- | -- |
| 2024 | $813 | $23,310 | $4,020 | $19,290 |
| 2023 | $813 | $23,310 | $4,020 | $19,290 |
| 2022 | $703 | $17,030 | $2,780 | $14,250 |
| 2021 | $760 | $17,520 | $2,860 | $14,660 |
| 2020 | $454 | $12,150 | $2,500 | $9,650 |
| 2019 | $451 | $12,150 | $2,500 | $9,650 |
| 2018 | $413 | $10,420 | $1,870 | $8,550 |
| 2017 | $418 | $10,420 | $1,870 | $8,550 |
| 2016 | $330 | $10,220 | $1,990 | $8,230 |
| 2015 | $339 | $10,220 | $1,990 | $8,230 |
| 2014 | $302 | $9,200 | $1,790 | $7,410 |
Property History
| Date | Event | Price | List to Sale | Price per Sq Ft |
|---|---|---|---|---|
| 11/24/2025 11/24/25 | Price Changed | $264,990 | -1.9% | $176 / Sq Ft |
| 11/14/2025 11/14/25 | Price Changed | $269,990 | -1.8% | $180 / Sq Ft |
| 11/07/2025 11/07/25 | For Sale | $274,999 | -- | $183 / Sq Ft |
Purchase History
| Date | Type | Sale Price | Title Company |
|---|---|---|---|
| Interfamily Deed Transfer | -- | None Available | |
| Quit Claim Deed | -- | Frtdd | |
| Deed | -- | -- | |
| Deed | -- | -- | |
| Deed | -- | -- |
Mortgage History
| Date | Status | Loan Amount | Loan Type |
|---|---|---|---|
| Open | $255,000 | Reverse Mortgage Home Equity Conversion Mortgage |
Source: REcolorado®
MLS Number: 2605991
APN: 65134-20-003
Disclaimer: Certain information contained herein is derived from information provided by parties other than Homes.com. All information provided is deemed reliable, but is not guaranteed to be accurate and should be independently verified.
![]() The content relating to real estate for sale in this Web site comes in part from the Internet Data eXchange (“IDX”) program of METROLIST, INC., DBA RECOLORADO®. Real estate listings held by brokers other than Ten-X are marked with the IDX Logo. This information is being provided for the consumers’ personal, non-commercial use and may not be used for any other purpose. All information subject to change and should be independently verified.
The content relating to real estate for sale in this Web site comes in part from the Internet Data eXchange (“IDX”) program of METROLIST, INC., DBA RECOLORADO®. Real estate listings held by brokers other than Ten-X are marked with the IDX Logo. This information is being provided for the consumers’ personal, non-commercial use and may not be used for any other purpose. All information subject to change and should be independently verified.
This publication is designed to provide information with regard to the subject matter covered. It is displayed with the understanding that the publisher and authors are not engaged in rendering real estate, legal, accounting, tax, or other professional services and that the publisher and authors are not offering such advice in this publication. If real estate, legal, or other expert assistance is required, the services of a competent, professional person should be sought.
The information contained in this publication is subject to change without notice. METROLIST, INC., DBA RECOLORADO MAKES NO WARRANTY OF ANY KIND WITH REGARD TO THIS MATERIAL, INCLUDING, BUT NOT LIMITED TO, THE IMPLIED WARRANTIES OF MERCHANTABILITY AND FITNESS FOR A PARTICULAR PURPOSE. METROLIST, INC., DBA RECOLORADO SHALL NOT BE LIABLE FOR ERRORS CONTAINED HEREIN OR FOR ANY DAMAGES IN CONNECTION WITH THE FURNISHING, PERFORMANCE, OR USE OF THIS MATERIAL.
PUBLISHER’S NOTICE: All real estate advertised herein is subject to the Federal Fair Housing Act and the Colorado Fair Housing Act, which Acts make it illegal to make or publish any advertisement that indicates any preference, limitation, or discrimination based on race, color, religion, sex, handicap, familial status, or national origin.
METROLIST, INC., DBA RECOLORADO will not knowingly accept any advertising for real estate that is in violation of the law. All persons are hereby informed that all dwellings advertised are available on an equal opportunity basis.
© 2025 METROLIST, INC., DBA RECOLORADO® – All Rights Reserved. 6455 S. Yosemite St., Suite 500 Greenwood Village, CO 80111 USA
ALL RIGHTS RESERVED WORLDWIDE. No part of this publication may be reproduced, adapted, translated, stored in a retrieval system or transmitted in any form or by any means, electronic, mechanical, photocopying, recording, or otherwise, without the prior written permission of the publisher. The information contained herein including but not limited to all text, photographs, digital images, virtual tours, may be seeded and monitored for protection and tracking.
- 6224 Gossamer St
- 1065 Harbourne St
- 102 Landoe Ln
- 80 Landoe Ln
- 95 Landoe Ln
- 6415 Gossamer St
- 1 N Dartmouth St
- 409 Kiva Rd
- 110 Dartmouth St
- 110 Fordham St
- 116 Dartmouth St
- 106 Kokomo St
- 123 Ely St
- 89 Security Blvd
- 480 Athens Dr
- 1240 Quinlan Ct
- 99 Security Blvd
- 101 Security Blvd
- 125 Ithaca St
- 128 Ithaca St
- 6216 Gossamer St
- 663 Seawell Dr
- 151 Harvard St
- 603 Del Brook Dr
- 1006 De la Vista Place
- 7195 Alegre Cir
- 6725 Defoe Ave
- 1808 River Dr
- 4813 Neon Way
- 4918 Gami Way
- 4814 Pathfinder Dr
- 524 Rowe Ln
- 7105 Gershwin Ct
- 5063 Marabou Way
- 4622 Whirling Oak Way
- 7165 Gold Pan Ct
- 120 Everett Dr
- 7210 Millbrook Ct
- 6365 San Mateo Dr
- 4574 Keagster Dr
