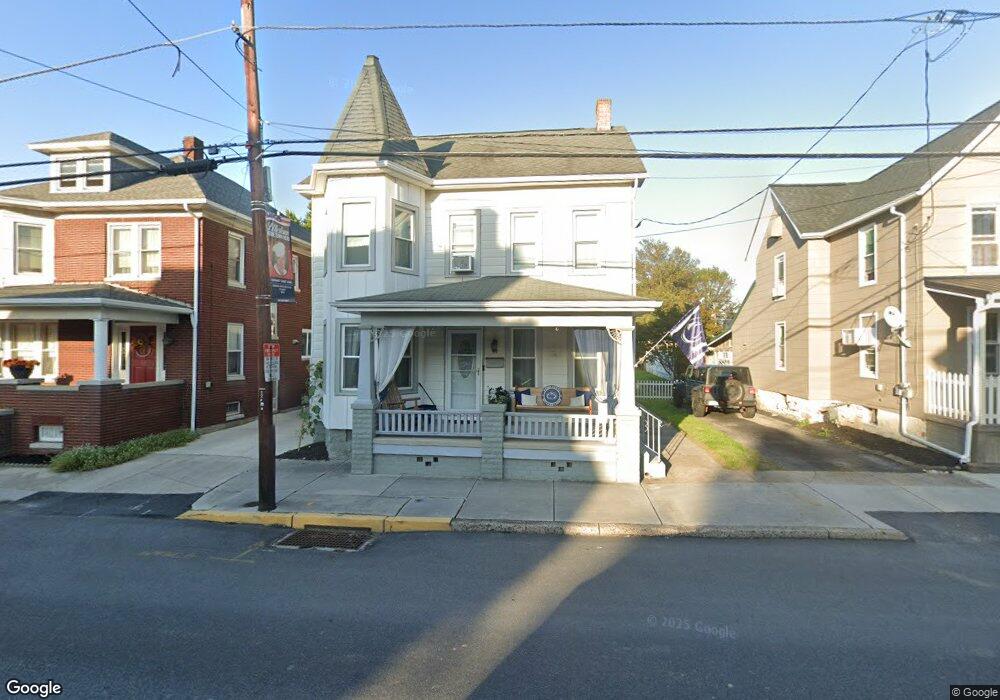
57 N Queen St Littlestown, PA 17340
Estimated Value: $264,000 - $300,981
3
Beds
2
Baths
2,308
Sq Ft
$121/Sq Ft
Est. Value
About This Home
This home is located at 57 N Queen St, Littlestown, PA 17340 and is currently estimated at $279,995, approximately $121 per square foot. 57 N Queen St is a home located in Adams County with nearby schools including Rolling Acres El School, Maple Avenue Middle School, and Littlestown Senior High School.
Ownership History
Date
Name
Owned For
Owner Type
Purchase Details
Closed on
Sep 29, 2020
Sold by
Chrismer Michael C and Chrismer Kristin A
Bought by
Chrismer Michael C
Current Estimated Value
Home Financials for this Owner
Home Financials are based on the most recent Mortgage that was taken out on this home.
Original Mortgage
$142,000
Outstanding Balance
$126,301
Interest Rate
2.9%
Mortgage Type
New Conventional
Estimated Equity
$153,694
Purchase Details
Closed on
May 18, 2012
Sold by
Kelley Timothy S and Kelley Debra L
Bought by
Chrismer Michael C and Chrismer Kristin A
Home Financials for this Owner
Home Financials are based on the most recent Mortgage that was taken out on this home.
Original Mortgage
$126,704
Interest Rate
4.4%
Mortgage Type
FHA
Create a Home Valuation Report for This Property
The Home Valuation Report is an in-depth analysis detailing your home's value as well as a comparison with similar homes in the area
Home Values in the Area
Average Home Value in this Area
Purchase History
| Date | Buyer | Sale Price | Title Company |
|---|---|---|---|
| Chrismer Michael C | -- | Title Services | |
| Chrismer Michael C | $130,000 | None Available |
Source: Public Records
Mortgage History
| Date | Status | Borrower | Loan Amount |
|---|---|---|---|
| Open | Chrismer Michael C | $142,000 | |
| Closed | Chrismer Michael C | $126,704 |
Source: Public Records
Tax History Compared to Growth
Tax History
| Year | Tax Paid | Tax Assessment Tax Assessment Total Assessment is a certain percentage of the fair market value that is determined by local assessors to be the total taxable value of land and additions on the property. | Land | Improvement |
|---|---|---|---|---|
| 2025 | $3,901 | $169,700 | $44,100 | $125,600 |
| 2024 | $3,759 | $169,700 | $44,100 | $125,600 |
| 2023 | $3,614 | $169,700 | $44,100 | $125,600 |
| 2022 | $3,592 | $169,700 | $44,100 | $125,600 |
| 2021 | $3,485 | $169,700 | $44,100 | $125,600 |
| 2020 | $3,444 | $169,700 | $44,100 | $125,600 |
| 2019 | $3,341 | $169,700 | $44,100 | $125,600 |
| 2018 | $3,280 | $169,700 | $44,100 | $125,600 |
| 2017 | $3,195 | $169,700 | $44,100 | $125,600 |
| 2016 | -- | $169,700 | $44,100 | $125,600 |
| 2015 | -- | $169,700 | $44,100 | $125,600 |
| 2014 | -- | $169,700 | $44,100 | $125,600 |
Source: Public Records
Map
Nearby Homes
- 115 Charles St
- 117 Charles St
- 61 E King St
- 106 E King St
- 129 W King St
- 22 Rita Marie Ave
- 140 Apple Grove Ln Unit 425
- 211 E King St
- 241 M St
- 440 N Queen St
- 162 Newark St
- 449 Glenwyn Dr
- 41 Smith Cir
- 161 Stoners Cir
- 535 Lumber St
- 58 Windsor Ct
- 48 Windsor Ct
- 20c Locust Dr
- 0 Locust Dr Unit PAAD2015910
- 559 Lumber St