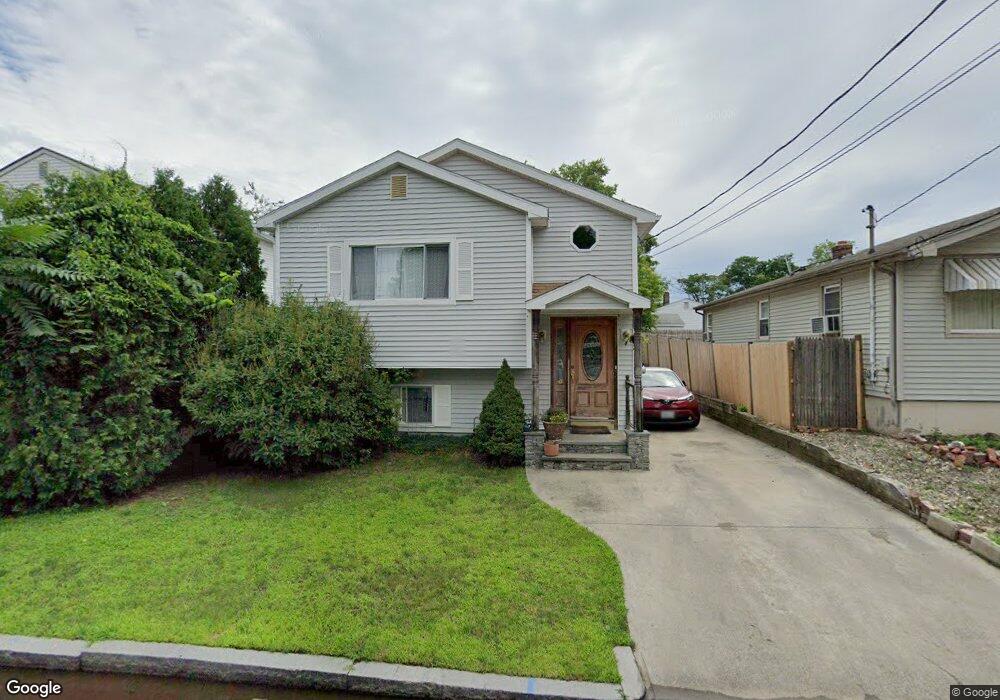
57 Ophelia St Providence, RI 02909
Hartford NeighborhoodEstimated Value: $386,000 - $428,000
5
Beds
2
Baths
1,840
Sq Ft
$219/Sq Ft
Est. Value
About This Home
This home is located at 57 Ophelia St, Providence, RI 02909 and is currently estimated at $402,606, approximately $218 per square foot. 57 Ophelia St is a home located in Providence County with nearby schools including Charles N. Fortes Elementary School, Asa Messer Elementary School, and Laurel Hill Annex School.
Ownership History
Date
Name
Owned For
Owner Type
Purchase Details
Closed on
Feb 17, 2005
Sold by
Vasquez William
Bought by
Sayong Fulgero
Current Estimated Value
Purchase Details
Closed on
Aug 21, 2003
Sold by
Deuso James R and Deuso Alissa A
Bought by
Casimiro Joseph C
Create a Home Valuation Report for This Property
The Home Valuation Report is an in-depth analysis detailing your home's value as well as a comparison with similar homes in the area
Home Values in the Area
Average Home Value in this Area
Purchase History
| Date | Buyer | Sale Price | Title Company |
|---|---|---|---|
| Sayong Fulgero | $230,500 | -- | |
| Casimiro Joseph C | $52,000 | -- |
Source: Public Records
Mortgage History
| Date | Status | Borrower | Loan Amount |
|---|---|---|---|
| Open | Casimiro Joseph C | $219,150 | |
| Closed | Casimiro Joseph C | $226,000 | |
| Closed | Casimiro Joseph C | $30,400 | |
| Closed | Casimiro Joseph C | $35,000 |
Source: Public Records
Tax History Compared to Growth
Tax History
| Year | Tax Paid | Tax Assessment Tax Assessment Total Assessment is a certain percentage of the fair market value that is determined by local assessors to be the total taxable value of land and additions on the property. | Land | Improvement |
|---|---|---|---|---|
| 2025 | $3,597 | $428,200 | $134,600 | $293,600 |
| 2024 | $5,593 | $304,800 | $85,100 | $219,700 |
| 2023 | $5,593 | $304,800 | $85,100 | $219,700 |
| 2022 | $5,425 | $304,800 | $85,100 | $219,700 |
| 2021 | $5,514 | $224,500 | $48,300 | $176,200 |
| 2020 | $5,514 | $224,500 | $48,300 | $176,200 |
| 2019 | $5,514 | $224,500 | $48,300 | $176,200 |
| 2018 | $5,305 | $166,000 | $41,100 | $124,900 |
| 2017 | $5,305 | $166,000 | $41,100 | $124,900 |
| 2016 | $5,305 | $166,000 | $41,100 | $124,900 |
| 2015 | $5,111 | $154,400 | $41,100 | $113,300 |
| 2014 | $5,211 | $154,400 | $41,100 | $113,300 |
| 2013 | $5,211 | $154,400 | $41,100 | $113,300 |
Source: Public Records
Map
Nearby Homes
- 60 Ophelia St
- 102 Ophelia St
- 15 Melissa St
- 17 Middleton St
- 162 Merino St
- 236 Lowell Ave
- 336 Killingly St Unit D
- 231 Lowell Ave
- 78 Stella St
- 129 Glenbridge Ave
- 18 Crowninshield St
- 93 Bowlet St
- 0 Central Ave Unit 1398155
- 8 Summit Ave
- 47 Alverson Ave
- 0 Orchard St Unit 1396394
- 0 Orchard St Unit 1396400
- 0 Orchard St Unit 1400488
- 0 Orchard St Unit 1395201
- 665 Plainfield St