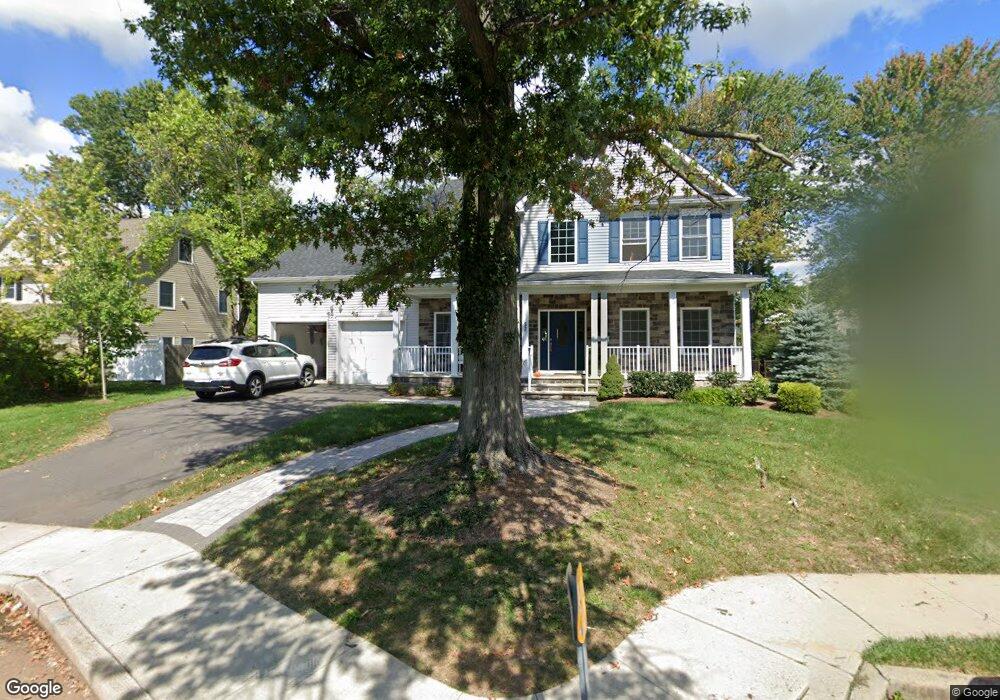
57 Orchard St Metuchen, NJ 08840
Estimated Value: $830,000 - $1,666,000
5
Beds
3
Baths
3,241
Sq Ft
$404/Sq Ft
Est. Value
About This Home
This home is located at 57 Orchard St, Metuchen, NJ 08840 and is currently estimated at $1,310,356, approximately $404 per square foot. 57 Orchard St is a home located in Middlesex County with nearby schools including Edgar Middle School, Campbell Elementary School, and Metuchen High School.
Ownership History
Date
Name
Owned For
Owner Type
Purchase Details
Closed on
Mar 13, 2018
Sold by
Anda Bulders Llc
Bought by
Leland Kenneth and Chin Stephanie
Current Estimated Value
Home Financials for this Owner
Home Financials are based on the most recent Mortgage that was taken out on this home.
Original Mortgage
$700,000
Outstanding Balance
$600,128
Interest Rate
4.4%
Mortgage Type
New Conventional
Estimated Equity
$710,228
Purchase Details
Closed on
Mar 31, 2017
Sold by
Kimura Reiji
Bought by
Anda Builders Llc
Home Financials for this Owner
Home Financials are based on the most recent Mortgage that was taken out on this home.
Interest Rate
4.14%
Create a Home Valuation Report for This Property
The Home Valuation Report is an in-depth analysis detailing your home's value as well as a comparison with similar homes in the area
Home Values in the Area
Average Home Value in this Area
Purchase History
| Date | Buyer | Sale Price | Title Company |
|---|---|---|---|
| Leland Kenneth | $875,000 | Westcor Land Title Ins Co | |
| Anda Builders Llc | $355,000 | -- |
Source: Public Records
Mortgage History
| Date | Status | Borrower | Loan Amount |
|---|---|---|---|
| Open | Leland Kenneth | $700,000 | |
| Previous Owner | Anda Builders Llc | -- |
Source: Public Records
Tax History Compared to Growth
Tax History
| Year | Tax Paid | Tax Assessment Tax Assessment Total Assessment is a certain percentage of the fair market value that is determined by local assessors to be the total taxable value of land and additions on the property. | Land | Improvement |
|---|---|---|---|---|
| 2025 | $29,559 | $425,000 | $160,000 | $265,000 |
| 2024 | $28,569 | $425,000 | $160,000 | $265,000 |
| 2023 | $28,569 | $425,000 | $160,000 | $265,000 |
| 2022 | $27,077 | $425,000 | $160,000 | $265,000 |
| 2021 | $26,456 | $425,000 | $160,000 | $265,000 |
| 2020 | $24,572 | $400,000 | $160,000 | $240,000 |
| 2019 | $23,848 | $400,000 | $160,000 | $240,000 |
| 2018 | $9,504 | $160,000 | $160,000 | $0 |
| 2017 | $9,716 | $164,100 | $96,500 | $67,600 |
| 2016 | $9,469 | $164,100 | $96,500 | $67,600 |
| 2015 | $9,259 | $164,100 | $96,500 | $67,600 |
| 2014 | $9,027 | $164,100 | $96,500 | $67,600 |
Source: Public Records
Map
Nearby Homes