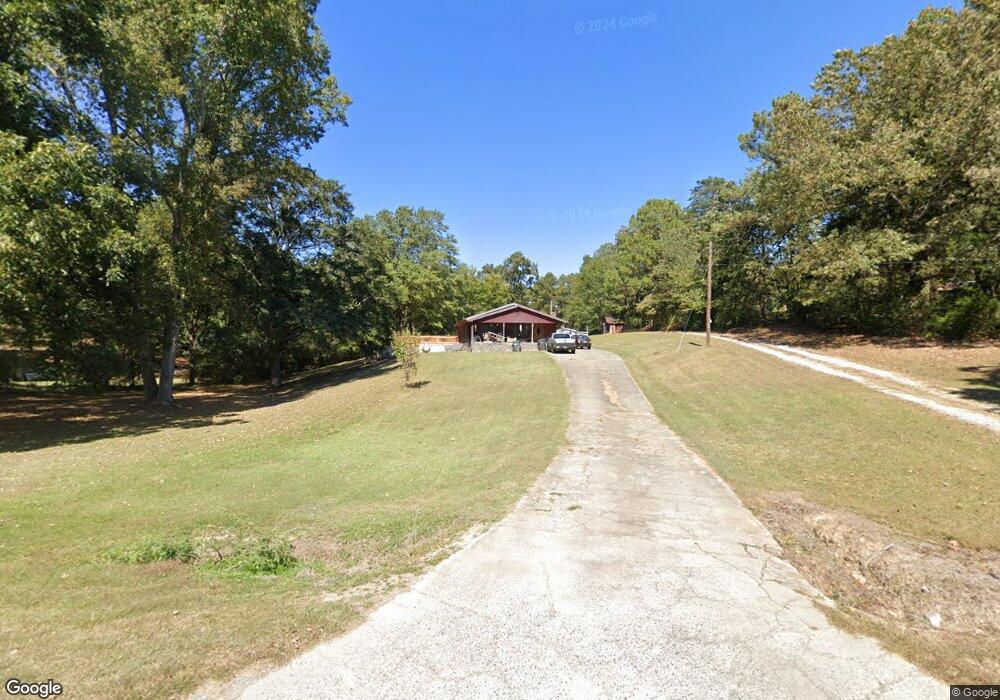
57 Pilgram Rd Rockmart, GA 30153
Estimated Value: $184,000 - $270,000
2
Beds
1
Bath
2,139
Sq Ft
$111/Sq Ft
Est. Value
About This Home
This home is located at 57 Pilgram Rd, Rockmart, GA 30153 and is currently estimated at $237,701, approximately $111 per square foot. 57 Pilgram Rd is a home located in Polk County.
Ownership History
Date
Name
Owned For
Owner Type
Purchase Details
Closed on
Dec 17, 2019
Sold by
Garrett Peggy Joyce
Bought by
Garrett Charles E and Garrett Peggy K
Current Estimated Value
Home Financials for this Owner
Home Financials are based on the most recent Mortgage that was taken out on this home.
Original Mortgage
$51,000
Outstanding Balance
$34,614
Interest Rate
3.6%
Mortgage Type
New Conventional
Estimated Equity
$203,087
Purchase Details
Closed on
Jun 29, 2004
Sold by
Garrett Charles Edward
Bought by
Garrett Peggy Kelley
Purchase Details
Closed on
Jun 24, 2004
Sold by
Garrett Charles Edward
Bought by
Garrett Peggy Joyce
Purchase Details
Closed on
Jan 15, 1985
Sold by
Pilgrim Daniel Chester
Bought by
Garrett Charles E
Purchase Details
Closed on
Nov 3, 1973
Sold by
Pilgrim Chester A and Pilgrim K
Bought by
Garrett Charles E
Purchase Details
Closed on
May 19, 1973
Sold by
Ferguson George D
Bought by
Garrett Charles E
Purchase Details
Closed on
Jul 17, 1958
Bought by
Ferguson George D
Create a Home Valuation Report for This Property
The Home Valuation Report is an in-depth analysis detailing your home's value as well as a comparison with similar homes in the area
Home Values in the Area
Average Home Value in this Area
Purchase History
| Date | Buyer | Sale Price | Title Company |
|---|---|---|---|
| Garrett Charles E | -- | -- | |
| Garrett Peggy Kelley | -- | -- | |
| Garrett Peggy Joyce | -- | -- | |
| Garrett Charles E | -- | -- | |
| Garrett Charles E | -- | -- | |
| Garrett Charles E | -- | -- | |
| Ferguson George D | -- | -- |
Source: Public Records
Mortgage History
| Date | Status | Borrower | Loan Amount |
|---|---|---|---|
| Open | Garrett Charles E | $51,000 |
Source: Public Records
Tax History Compared to Growth
Tax History
| Year | Tax Paid | Tax Assessment Tax Assessment Total Assessment is a certain percentage of the fair market value that is determined by local assessors to be the total taxable value of land and additions on the property. | Land | Improvement |
|---|---|---|---|---|
| 2024 | $1,384 | $68,207 | $3,251 | $64,956 |
| 2023 | $1,096 | $48,187 | $3,251 | $44,936 |
| 2022 | $951 | $42,087 | $2,167 | $39,920 |
| 2021 | $964 | $42,087 | $2,167 | $39,920 |
| 2020 | $966 | $42,087 | $2,167 | $39,920 |
| 2019 | $1,032 | $40,447 | $2,167 | $38,280 |
| 2018 | $988 | $37,849 | $2,167 | $35,682 |
| 2017 | $976 | $37,849 | $2,167 | $35,682 |
| 2016 | $1,000 | $38,750 | $3,068 | $35,682 |
| 2015 | $1,014 | $39,144 | $3,068 | $36,076 |
| 2014 | $1,021 | $39,144 | $3,068 | $36,076 |
Source: Public Records
Map
Nearby Homes
- 1714 Cedartown Hwy
- 740 Calloway Dr
- 702 Calloway Dr
- 197 Oak Hill Dr
- 1211 Bellview Rd
- 0 Highway 278 Nathan Dean Bypass Unit 10134156
- 722 Prospect Rd
- 278 Oak Hill Dr
- 0 Pine Mountain St Unit 10620510
- 0 Pine Mountain St Unit 10620492
- 65 Wheeler Rd
- 1039 Old Cedartown Rd
- 89 Wheeler Rd
- 18 Hillside Dr
- 1 Pine Mountain Rd
- 0 Morgan Valley Rd Unit 7614571
- 0 Morgan Valley Rd Unit 10563202
- 865 Morgan Valley Rd
- 132 Highland Dr
- 102 Highland Dr
- 392 Clarkwood Rd
- 410 Clarkwood Rd
- 1220 Crossroads Church Rd
- 446 Clarkwood Rd
- 106 Pilgram Rd
- 383 Clarkwood Rd
- 28 Pilgram Rd
- 415 Clarkwood Rd
- 447 Clarkwood Rd
- 429 Clarkwood Rd
- 84 Martin Rd
- 455 Clarkwood Rd
- 330 Clarkwood Rd
- 357 Clarkwood Rd
- 503 Clarkwood Rd
- 166 Pilgram Rd
- 520 Clarkwood Rd
- 130 Martin Rd
- 0 Martin Rd Unit 8462230
- 0 Martin Rd Unit 8256551