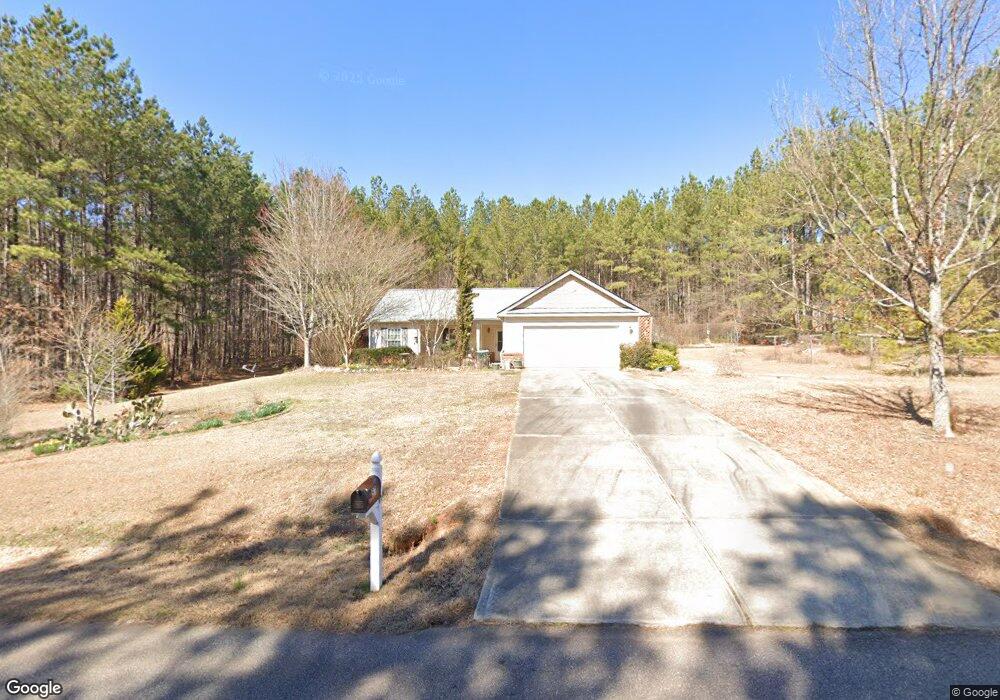
57 Pinewood Cir Colbert, GA 30628
Estimated Value: $291,348 - $320,000
3
Beds
2
Baths
1,228
Sq Ft
$248/Sq Ft
Est. Value
About This Home
This home is located at 57 Pinewood Cir, Colbert, GA 30628 and is currently estimated at $304,087, approximately $247 per square foot. 57 Pinewood Cir is a home located in Oglethorpe County with nearby schools including Oglethorpe County Primary School, Oglethorpe County Elementary School, and Oglethorpe County Middle School.
Ownership History
Date
Name
Owned For
Owner Type
Purchase Details
Closed on
Apr 30, 2007
Sold by
Coppinger Donna M
Bought by
Colquett Mark H
Current Estimated Value
Purchase Details
Closed on
Feb 4, 2005
Sold by
Star Home Builders Inc
Bought by
Coppinger Donna M
Home Financials for this Owner
Home Financials are based on the most recent Mortgage that was taken out on this home.
Original Mortgage
$112,000
Interest Rate
5.69%
Mortgage Type
New Conventional
Purchase Details
Closed on
Jul 26, 2004
Sold by
J & V Development Inc
Bought by
Star Home Builders Inc
Purchase Details
Closed on
Oct 6, 2003
Sold by
Berkshire Hills Llc
Bought by
Jung Brenda B and Vick Randall E
Create a Home Valuation Report for This Property
The Home Valuation Report is an in-depth analysis detailing your home's value as well as a comparison with similar homes in the area
Home Values in the Area
Average Home Value in this Area
Purchase History
| Date | Buyer | Sale Price | Title Company |
|---|---|---|---|
| Colquett Mark H | $124,900 | -- | |
| Coppinger Donna M | $117,900 | -- | |
| Star Home Builders Inc | $364,000 | -- | |
| J & V Development Inc | -- | -- | |
| Jung Brenda B | $660,000 | -- |
Source: Public Records
Mortgage History
| Date | Status | Borrower | Loan Amount |
|---|---|---|---|
| Previous Owner | Coppinger Donna M | $112,000 |
Source: Public Records
Tax History Compared to Growth
Tax History
| Year | Tax Paid | Tax Assessment Tax Assessment Total Assessment is a certain percentage of the fair market value that is determined by local assessors to be the total taxable value of land and additions on the property. | Land | Improvement |
|---|---|---|---|---|
| 2024 | $2,003 | $85,840 | $12,000 | $73,840 |
| 2023 | $1,707 | $89,560 | $12,000 | $77,560 |
| 2022 | $1,681 | $67,400 | $8,000 | $59,400 |
| 2021 | $1,483 | $53,680 | $8,000 | $45,680 |
| 2020 | $1,133 | $53,680 | $8,000 | $45,680 |
| 2019 | $1,496 | $53,680 | $8,000 | $45,680 |
| 2018 | $1,375 | $45,524 | $10,260 | $35,264 |
| 2017 | $1,320 | $45,524 | $10,260 | $35,264 |
| 2016 | $1,291 | $45,524 | $10,260 | $35,264 |
| 2015 | -- | $45,524 | $10,260 | $35,264 |
| 2014 | -- | $45,524 | $10,260 | $35,264 |
| 2013 | -- | $45,524 | $10,260 | $35,264 |
Source: Public Records
Map
Nearby Homes
- 134 Mitchell Farm Rd
- 203 Pinewood Cir
- 54 Red Oak Run
- 59 Cotton Cir
- 168 Highlands Dr Unit 5A
- 142 Highlands Dr
- 152 Oxmoor Ln Unit 11B
- 314 Skyview Dr Unit 7C
- 26 Creek Ridge
- 46 Creek Ridge
- 152 Sarah's Way
- 78 Shadow Lake Dr Unit 28B
- 546 Hargrove Lake Rd Unit 2B
- 20 Fifth Cir
- 12 Beaverdam Creek Rd
- 186 Hargrove Cir
- 200 Hargrove Cir
- 36 Blackthorn Ln
- 159 Hargrove Cir
- 147 Conifer Ct
- 49 Pinewood Cir
- 54 Pinewood Cir
- 17 Pinehill Ct
- 12 Pinehill Ct
- 25 Pinehill Ct
- 44 Pinewood Cir
- 66 Pinewood Cir
- 41 Pinewood Cir
- 20 Pinehill Ct
- 80 Pinewood Cir
- 36 Pinewood Cir
- 75 Pinewood Cir
- 20 Pinehill Ct
- 87 Pinewood Cir
- 28 Pinewood Cir
- 23 Pinewood Cir
- 18 Pinewood Cir
- 15 Pinewood Cir
- 138 Mitchell Farm Rd
- 109 Pinewood Cir