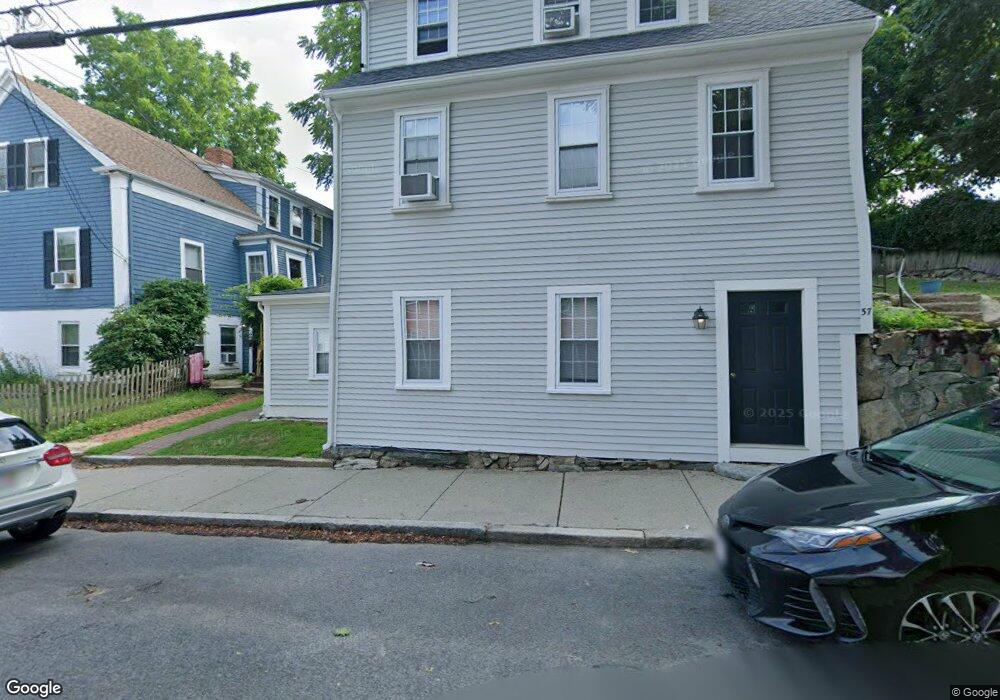
57 Pleasant St Plymouth, MA 02360
Plymouth Center NeighborhoodEstimated Value: $732,000 - $891,000
4
Beds
3
Baths
2,663
Sq Ft
$303/Sq Ft
Est. Value
About This Home
This home is located at 57 Pleasant St, Plymouth, MA 02360 and is currently estimated at $807,667, approximately $303 per square foot. 57 Pleasant St is a home located in Plymouth County with nearby schools including Nathaniel Morton Elementary School, Plymouth Community Intermediate, and Plymouth North High School.
Ownership History
Date
Name
Owned For
Owner Type
Purchase Details
Closed on
Apr 3, 2015
Sold by
Ferreira John T
Bought by
Old Cape Realty Llc
Current Estimated Value
Purchase Details
Closed on
Nov 26, 1991
Sold by
Garden Mgmt Co Inc
Bought by
Ferreira John T
Home Financials for this Owner
Home Financials are based on the most recent Mortgage that was taken out on this home.
Original Mortgage
$57,400
Interest Rate
8.7%
Mortgage Type
Purchase Money Mortgage
Create a Home Valuation Report for This Property
The Home Valuation Report is an in-depth analysis detailing your home's value as well as a comparison with similar homes in the area
Home Values in the Area
Average Home Value in this Area
Purchase History
| Date | Buyer | Sale Price | Title Company |
|---|---|---|---|
| Old Cape Realty Llc | -- | -- | |
| Ferreira John T | $82,000 | -- |
Source: Public Records
Mortgage History
| Date | Status | Borrower | Loan Amount |
|---|---|---|---|
| Previous Owner | Ferreira John T | $57,400 | |
| Previous Owner | Ferreira John T | $57,400 |
Source: Public Records
Tax History Compared to Growth
Tax History
| Year | Tax Paid | Tax Assessment Tax Assessment Total Assessment is a certain percentage of the fair market value that is determined by local assessors to be the total taxable value of land and additions on the property. | Land | Improvement |
|---|---|---|---|---|
| 2025 | $7,350 | $579,200 | $244,100 | $335,100 |
| 2024 | $6,749 | $524,400 | $221,900 | $302,500 |
| 2023 | $6,634 | $483,900 | $198,100 | $285,800 |
| 2022 | $7,133 | $462,300 | $189,300 | $273,000 |
| 2021 | $6,445 | $398,800 | $189,300 | $209,500 |
| 2020 | $6,332 | $387,300 | $179,600 | $207,700 |
| 2019 | $6,348 | $383,800 | $176,100 | $207,700 |
| 2018 | $6,070 | $368,800 | $162,900 | $205,900 |
| 2017 | $5,780 | $348,600 | $162,900 | $185,700 |
| 2016 | $5,672 | $348,600 | $162,900 | $185,700 |
| 2015 | $5,417 | $348,600 | $162,900 | $185,700 |
| 2014 | $5,305 | $350,600 | $179,200 | $171,400 |
Source: Public Records
Map
Nearby Homes
- 14-16 South St
- 20 Bradford St
- 14 Meadowbrook Dr
- 13 Whiting St Unit 2
- 27 1/2 Fremont St Unit 2
- 8 Carver St
- 38 Russell St Unit 4
- 126 Summer St
- 132 Summer St
- 7 Sever St Unit 2
- 10 Brewster St
- 4 Nook Rd
- 23 Howland St Unit 4
- 26 Howland St
- 6 Bishop
- 91 Newfield St Unit 34
- 76 Court St Unit 6
- 76 Court St Unit 4
- 204 Sandwich St Unit 2N
- 7-9 S Park Ave
- 10 1/2 Washington St
- 6 Washington St
- 8 Washington St
- 10 Washington St Unit 1
- 10 Washington St
- 36 Mayflower St
- 36 Mayflower St
- 57 1/2 Pleasant St
- 53 Pleasant St
- 59 Pleasant St
- 12 Washington St
- 5 Washington St
- 5 Washington St Unit 5
- 5 Washington St Unit house
- 5 Washington St
- 7 Washington St
- 9 Washington St
- 32 Mayflower St
- 51 Pleasant St
- 51 Pleasant St Unit 3