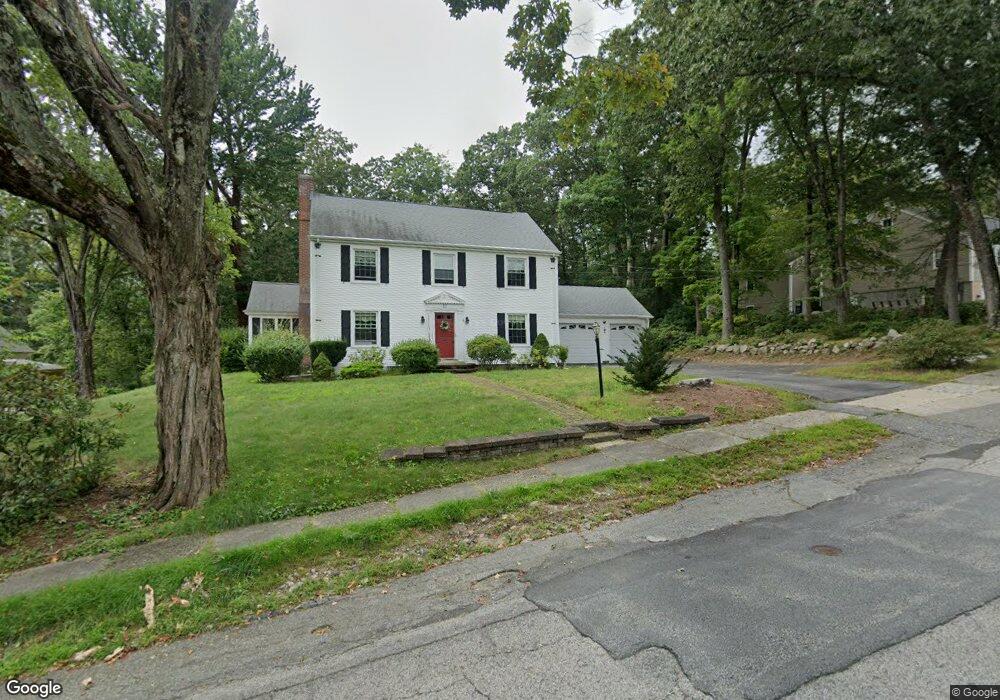
57 Prospect St Whitinsville, MA 01588
Estimated Value: $608,799 - $774,000
4
Beds
3
Baths
2,268
Sq Ft
$290/Sq Ft
Est. Value
About This Home
This home is located at 57 Prospect St, Whitinsville, MA 01588 and is currently estimated at $656,950, approximately $289 per square foot. 57 Prospect St is a home located in Worcester County with nearby schools including Northbridge Elementary School, Northbridge Middle School, and Northbridge High School.
Ownership History
Date
Name
Owned For
Owner Type
Purchase Details
Closed on
Apr 15, 2004
Sold by
Malkasian Claire A and Malkasian Enoch
Bought by
Malkasian Claire A and Malkasian Enoch
Current Estimated Value
Purchase Details
Closed on
Aug 24, 1978
Bought by
Malksian Enoch and Malksian Claire A
Create a Home Valuation Report for This Property
The Home Valuation Report is an in-depth analysis detailing your home's value as well as a comparison with similar homes in the area
Home Values in the Area
Average Home Value in this Area
Purchase History
| Date | Buyer | Sale Price | Title Company |
|---|---|---|---|
| Malkasian Claire A | -- | -- | |
| Malkasian Claire A | -- | -- | |
| Malksian Enoch | -- | -- |
Source: Public Records
Mortgage History
| Date | Status | Borrower | Loan Amount |
|---|---|---|---|
| Previous Owner | Malksian Enoch | $105,000 | |
| Previous Owner | Malksian Enoch | $19,000 | |
| Previous Owner | Malksian Enoch | $100,000 | |
| Previous Owner | Malksian Enoch | $83,000 |
Source: Public Records
Tax History Compared to Growth
Tax History
| Year | Tax Paid | Tax Assessment Tax Assessment Total Assessment is a certain percentage of the fair market value that is determined by local assessors to be the total taxable value of land and additions on the property. | Land | Improvement |
|---|---|---|---|---|
| 2025 | $5,886 | $499,200 | $160,000 | $339,200 |
| 2024 | $5,884 | $486,700 | $160,000 | $326,700 |
| 2023 | $5,888 | $454,300 | $160,000 | $294,300 |
| 2022 | $5,509 | $400,100 | $124,000 | $276,100 |
| 2021 | $5,477 | $378,000 | $118,200 | $259,800 |
| 2020 | $5,074 | $366,600 | $118,200 | $248,400 |
| 2019 | $4,525 | $348,900 | $118,200 | $230,700 |
| 2018 | $4,332 | $334,800 | $112,600 | $222,200 |
| 2017 | $4,301 | $317,900 | $112,600 | $205,300 |
| 2016 | $4,120 | $299,600 | $102,400 | $197,200 |
| 2015 | $4,009 | $299,600 | $102,400 | $197,200 |
| 2014 | $3,973 | $299,600 | $102,400 | $197,200 |
Source: Public Records
Map
Nearby Homes
- Lots 1-9 Spring St
- 90 Nathaniel Dr
- 18 East St Unit 24
- 21 Granite St
- 121 East St Unit 121
- 894 Marston Rd
- 5 Summit St
- 128 Linwood Ave
- 1 Elm St
- 708 Marston Rd
- 9 Banning Dr
- 33 Crestwood Cir Unit 45
- 192 Rebecca Rd
- 140 Rolling Ridge Dr Unit 78
- 46 Rebecca Rd
- 39 Crestwood Cir Unit 42
- 159 Rolling Ridge Dr Unit 85
- 169 Rolling Ridge Dr Unit 97
- 24 Crescent St Unit 6
- 86 Kingsnorth St
- 65-67 Prospect St
- 53 Prospect St
- 61 Prospect St
- 54 Prospect St Unit 56
- 49 Prospect St
- 62 Prospect St
- 68 Prospect St
- 73 Prospect St
- 50 Prospect St
- 41 Prospect St
- 74 Prospect St
- 44 Prospect St Unit 46
- 54-56 Prospect St
- 79 Prospect St
- 79 Prospect St Unit 79
- 76 Prospect St Unit 78
- 76 Prospect St Unit 76
- 77 Prospect St
- 77 Prospect St Unit 77
- 42 Prospect St