Estimated Value: $224,000 - $241,000
3
Beds
1
Bath
1,500
Sq Ft
$154/Sq Ft
Est. Value
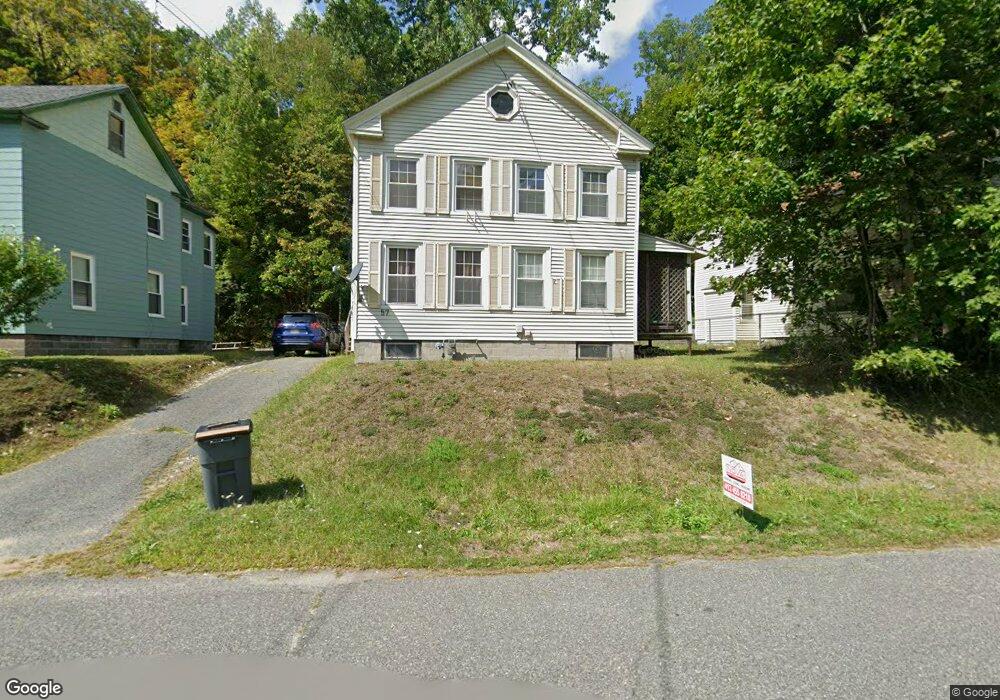
About This Home
This home is located at 57 Quality St, Adams, MA 01220 and is currently estimated at $231,560, approximately $154 per square foot. 57 Quality St is a home located in Berkshire County with nearby schools including Hoosac Valley Middle & High School, Berkshire Arts & Technology Charter Public School, and St. Stanislaus Kostka School.
Ownership History
Date
Name
Owned For
Owner Type
Purchase Details
Closed on
Feb 23, 2001
Sold by
Briggs Bradley R and Schwab George
Bought by
Howe Theodore A
Current Estimated Value
Home Financials for this Owner
Home Financials are based on the most recent Mortgage that was taken out on this home.
Original Mortgage
$74,600
Interest Rate
6.89%
Mortgage Type
Purchase Money Mortgage
Purchase Details
Closed on
Apr 8, 1997
Sold by
Fnma
Bought by
Briggs Bradley R
Purchase Details
Closed on
Apr 27, 1990
Sold by
Herrmann Robert
Bought by
Mcdaniel Thomas E
Create a Home Valuation Report for This Property
The Home Valuation Report is an in-depth analysis detailing your home's value as well as a comparison with similar homes in the area
Home Values in the Area
Average Home Value in this Area
Purchase History
| Date | Buyer | Sale Price | Title Company |
|---|---|---|---|
| Howe Theodore A | $70,000 | -- | |
| Briggs Bradley R | $61,000 | -- | |
| Mcdaniel Thomas E | $67,000 | -- |
Source: Public Records
Mortgage History
| Date | Status | Borrower | Loan Amount |
|---|---|---|---|
| Open | Mcdaniel Thomas E | $91,432 | |
| Closed | Mcdaniel Thomas E | $96,662 | |
| Closed | Mcdaniel Thomas E | $74,600 |
Source: Public Records
Tax History
| Year | Tax Paid | Tax Assessment Tax Assessment Total Assessment is a certain percentage of the fair market value that is determined by local assessors to be the total taxable value of land and additions on the property. | Land | Improvement |
|---|---|---|---|---|
| 2025 | $2,734 | $160,700 | $44,400 | $116,300 |
| 2024 | $2,578 | $147,000 | $41,600 | $105,400 |
| 2023 | $2,413 | $130,100 | $38,300 | $91,800 |
| 2022 | $2,394 | $114,600 | $33,300 | $81,300 |
| 2021 | $5,996 | $103,500 | $33,300 | $70,200 |
| 2020 | $3,064 | $104,400 | $33,300 | $71,100 |
| 2019 | $5,684 | $104,400 | $33,300 | $71,100 |
| 2018 | $5,649 | $103,000 | $33,300 | $69,700 |
| 2017 | $2,762 | $103,000 | $33,300 | $69,700 |
| 2016 | $1,831 | $85,600 | $33,300 | $52,300 |
| 2015 | $1,810 | $84,700 | $35,000 | $49,700 |
| 2014 | $1,690 | $84,700 | $35,000 | $49,700 |
Source: Public Records
Map
Nearby Homes
Your Personal Tour Guide
Ask me questions while you tour the home.