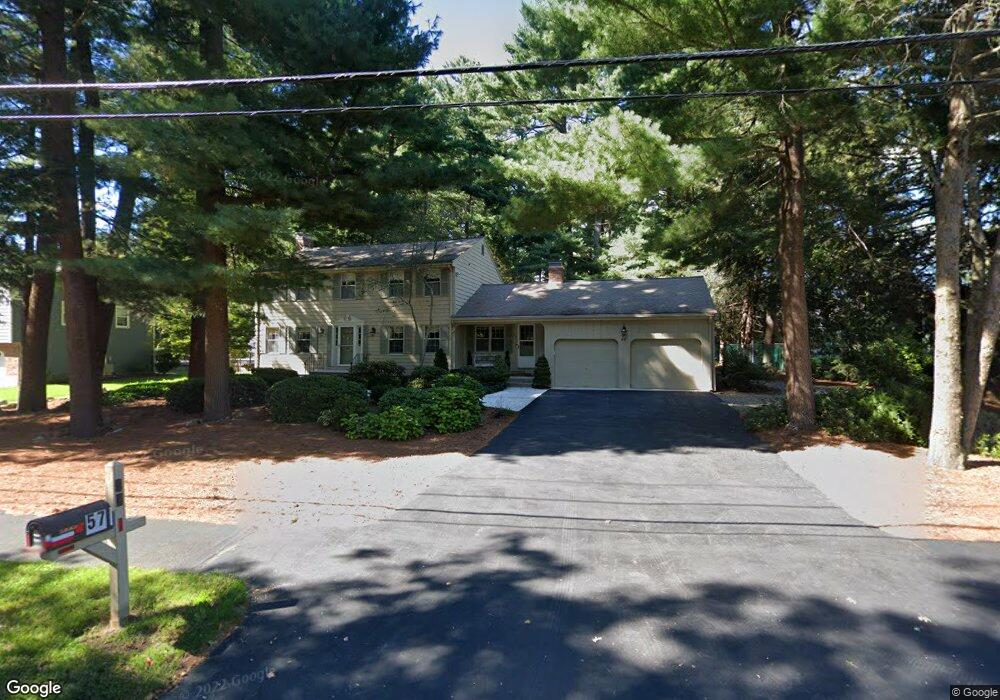
57 Rustic Ln Reading, MA 01867
Estimated Value: $1,142,000 - $1,224,000
4
Beds
4
Baths
2,753
Sq Ft
$429/Sq Ft
Est. Value
About This Home
This home is located at 57 Rustic Ln, Reading, MA 01867 and is currently estimated at $1,181,902, approximately $429 per square foot. 57 Rustic Ln is a home located in Middlesex County with nearby schools including Wood End Elementary School, Arthur W. Coolidge Middle School, and Reading Memorial High School.
Ownership History
Date
Name
Owned For
Owner Type
Purchase Details
Closed on
May 16, 2014
Sold by
Gregorio Philip J and Gregorio Donna L
Bought by
Gregorio Ft and Gregorio
Current Estimated Value
Create a Home Valuation Report for This Property
The Home Valuation Report is an in-depth analysis detailing your home's value as well as a comparison with similar homes in the area
Home Values in the Area
Average Home Value in this Area
Purchase History
| Date | Buyer | Sale Price | Title Company |
|---|---|---|---|
| Gregorio Ft | -- | -- |
Source: Public Records
Tax History
| Year | Tax Paid | Tax Assessment Tax Assessment Total Assessment is a certain percentage of the fair market value that is determined by local assessors to be the total taxable value of land and additions on the property. | Land | Improvement |
|---|---|---|---|---|
| 2025 | $11,925 | $1,047,000 | $599,000 | $448,000 |
| 2024 | $12,072 | $1,030,000 | $589,300 | $440,700 |
| 2023 | $11,360 | $902,300 | $516,200 | $386,100 |
| 2022 | $11,346 | $851,200 | $487,000 | $364,200 |
| 2021 | $10,881 | $787,900 | $445,600 | $342,300 |
| 2020 | $5,502 | $749,200 | $423,700 | $325,500 |
| 2019 | $5,511 | $703,900 | $398,100 | $305,800 |
| 2018 | $5,314 | $658,800 | $372,600 | $286,200 |
| 2017 | $5,085 | $645,800 | $365,200 | $280,600 |
| 2016 | $8,204 | $565,800 | $331,500 | $234,300 |
| 2015 | $7,595 | $516,700 | $302,700 | $214,000 |
| 2014 | $7,541 | $511,600 | $299,700 | $211,900 |
Source: Public Records
Map
Nearby Homes
- 32 Granger Ave
- 11 Clover Cir Unit A
- 16 Briarwood Ave
- 0 Charles St Unit 72374573
- 43 Ashley Place
- 18 Symonds Way
- 50 Forest St
- 119 Van Norden Rd
- 27 Audubon Rd
- 68 Sanborn Ln
- 141 Belmont St
- 44 Grandview Rd
- 41 Winter St
- 99 Grove St
- 36 Main St Unit 1
- 42 Main St Unit 22
- 48 Village St Unit 1001
- 4 Hickory Ln
- 28 Nutter Rd
- 5 Washington St Unit D4
Your Personal Tour Guide
Ask me questions while you tour the home.