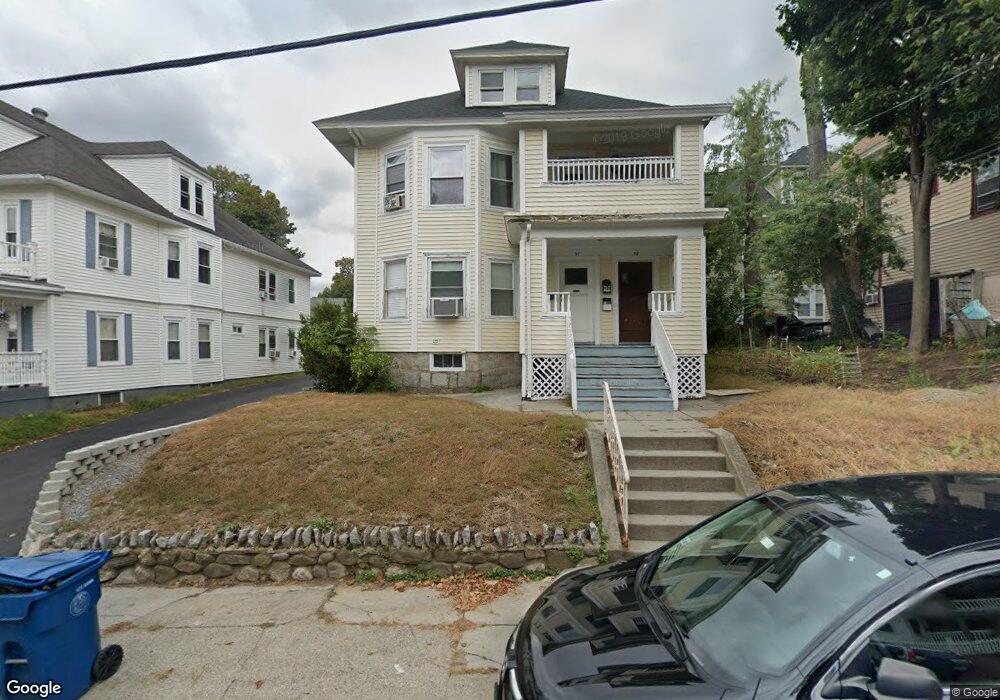
57 Saunders St Unit 5 Lawrence, MA 01841
Arlington NeighborhoodEstimated Value: $285,000 - $328,000
3
Beds
1
Bath
879
Sq Ft
$341/Sq Ft
Est. Value
About This Home
This home is located at 57 Saunders St Unit 5, Lawrence, MA 01841 and is currently estimated at $299,622, approximately $340 per square foot. 57 Saunders St Unit 5 is a home located in Essex County with nearby schools including School For Exceptional Studies and Central Catholic High School.
Ownership History
Date
Name
Owned For
Owner Type
Purchase Details
Closed on
Nov 16, 2018
Sold by
Campbell Elena
Bought by
Saw Realty Llc
Current Estimated Value
Purchase Details
Closed on
Jun 3, 2011
Sold by
Perez Ramon
Bought by
Perez Jose R
Purchase Details
Closed on
Sep 19, 2008
Sold by
Creese Daryl M
Bought by
Perez Ramon
Home Financials for this Owner
Home Financials are based on the most recent Mortgage that was taken out on this home.
Original Mortgage
$95,000
Interest Rate
6.54%
Mortgage Type
Purchase Money Mortgage
Purchase Details
Closed on
Oct 2, 2000
Sold by
Saunders St Holding Co
Bought by
Creese Daryl M
Home Financials for this Owner
Home Financials are based on the most recent Mortgage that was taken out on this home.
Original Mortgage
$173,040
Interest Rate
7.94%
Mortgage Type
Purchase Money Mortgage
Create a Home Valuation Report for This Property
The Home Valuation Report is an in-depth analysis detailing your home's value as well as a comparison with similar homes in the area
Home Values in the Area
Average Home Value in this Area
Purchase History
| Date | Buyer | Sale Price | Title Company |
|---|---|---|---|
| Saw Realty Llc | -- | -- | |
| Saw Realty Llc | -- | -- | |
| Perez Jose R | -- | -- | |
| Perez Jose R | -- | -- | |
| Perez Ramon | $140,000 | -- | |
| Perez Ramon | $140,000 | -- | |
| Creese Daryl M | $180,000 | -- | |
| Creese Daryl M | $180,000 | -- |
Source: Public Records
Mortgage History
| Date | Status | Borrower | Loan Amount |
|---|---|---|---|
| Previous Owner | Perez Ramon | $95,000 | |
| Previous Owner | Creese Daryl M | $204,000 | |
| Previous Owner | Creese Daryl M | $173,040 |
Source: Public Records
Tax History
| Year | Tax Paid | Tax Assessment Tax Assessment Total Assessment is a certain percentage of the fair market value that is determined by local assessors to be the total taxable value of land and additions on the property. | Land | Improvement |
|---|---|---|---|---|
| 2025 | $1,707 | $194,000 | $0 | $194,000 |
| 2024 | $1,612 | $174,300 | $0 | $174,300 |
| 2023 | $1,574 | $154,900 | $0 | $154,900 |
| 2022 | $1,644 | $143,700 | $0 | $143,700 |
| 2021 | $1,567 | $127,700 | $0 | $127,700 |
| 2020 | $1,489 | $119,800 | $0 | $119,800 |
| 2019 | $1,509 | $110,300 | $0 | $110,300 |
| 2018 | $1,413 | $98,700 | $0 | $98,700 |
| 2017 | $1,371 | $89,400 | $0 | $89,400 |
| 2016 | $1,351 | $87,100 | $0 | $87,100 |
| 2015 | $1,317 | $87,100 | $0 | $87,100 |
Source: Public Records
Map
Nearby Homes
- 131A Lawrence St Unit 40
- 129-131 Lexington St
- 7-9 Bennington St
- 5 Kendrick St
- 192 Union St
- 434-438 Hampshire St
- 91 Summer St Unit 2
- 27 Willow St Unit A
- 89 Newbury St Unit 89B
- 80-82 Haverhill St
- 71-75 Common St
- 11 Lawrence St Unit 606
- 25-27 Bicknell Ave
- 10 Holly St
- 46 Amesbury St Unit 2B
- 324-326 Broadway
- 162 E Haverhill St
- 14 Court St
- 36 Manchester St
- 29-31 Washington St
- 57 Saunders St
- 57 Saunders St Unit 6
- 57 Saunders St Unit 4
- 57 Saunders St Unit 3
- 57 Saunders St Unit 2
- 57 Saunders St Unit 1
- 57 Saunders St Unit 59
- 7 Saunders St Unit 3
- 7 Saunders St Unit 2
- 7 Saunders St Unit 1
- 5 Saunders St Unit 7
- 5 Saunders St Unit 3
- 5 Saunders St Unit 1
- 5 Saunders St Unit 2
- 5 Saunders St
- 11 Saunders St Unit 13
- 57 Fitz St
- 5-7 Fitz St
- 11-13 Saunders St
- 85 Avon St Unit 87
Your Personal Tour Guide
Ask me questions while you tour the home.