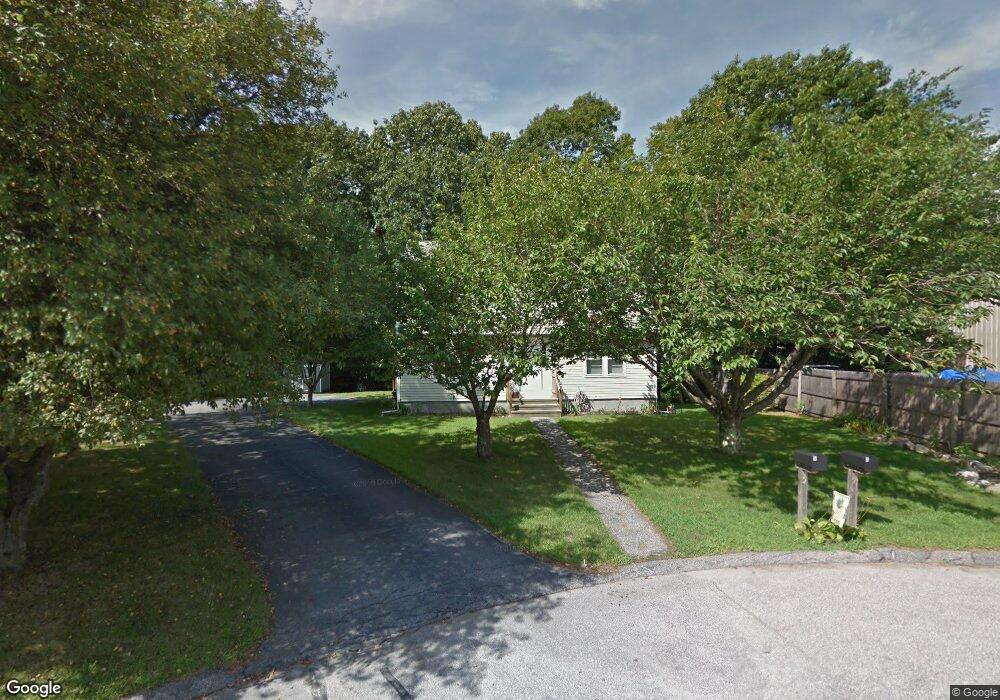
57 Sessa Ln Niantic, CT 06357
Estimated Value: $429,879 - $551,000
About This Home
This home is located at 57 Sessa Ln, Niantic, CT 06357 and is currently estimated at $489,220, approximately $271 per square foot. 57 Sessa Ln is a home located in New London County with nearby schools including East Lyme Middle School, East Lyme High School, and The Light House Voc-Ed Center.
Ownership History
We collect this data history from publicly available records. To have your information removed, we recommend requesting removal directly through your county’s website.
Purchase Details
Purchase Details
Purchase Details
Purchase Details
Purchase Details
Home Financials for this Owner
Home Financials are based on the most recent Mortgage that was taken out on this home.Purchase Details
Home Values in the Area
Average Home Value in this Area
Purchase History
We collect this data history from publicly available records. To have your information removed, we recommend requesting removal directly through your county’s website.
| Date | Buyer | Sale Price | Title Company |
|---|---|---|---|
| -- | -- | ||
| -- | -- | ||
| $207,500 | -- | ||
| $207,500 | -- | ||
| -- | -- | ||
| -- | -- | ||
| $176,000 | -- | ||
| $176,000 | -- | ||
| $281,000 | -- | ||
| $281,000 | -- | ||
| $112,000 | -- | ||
| $112,000 | -- |
Mortgage History
We collect this data history from publicly available records. To have your information removed, we recommend requesting removal directly through your county’s website.
| Date | Status | Borrower | Loan Amount |
|---|---|---|---|
| Previous Owner | $252,900 |
Tax History
We collect this data history from publicly available records. To have your information removed, we recommend requesting removal directly through your county’s website.
| Year | Tax Paid | Tax Assessment Tax Assessment Total Assessment is a certain percentage of the fair market value that is determined by local assessors to be the total taxable value of land and additions on the property. | Land | Improvement |
|---|---|---|---|---|
| 2025 | $4,492 | $160,370 | $68,460 | $91,910 |
| 2024 | $4,226 | $160,370 | $68,460 | $91,910 |
| 2023 | $3,990 | $160,370 | $68,460 | $91,910 |
| 2022 | $3,823 | $160,370 | $68,460 | $91,910 |
| 2021 | $3,951 | $138,600 | $64,470 | $74,130 |
| 2020 | $3,931 | $138,600 | $64,470 | $74,130 |
| 2019 | $3,907 | $138,600 | $64,470 | $74,130 |
| 2018 | $3,791 | $138,600 | $64,470 | $74,130 |
| 2017 | $3,626 | $138,600 | $64,470 | $74,130 |
| 2016 | $3,389 | $133,630 | $56,420 | $77,210 |
| 2015 | $3,302 | $133,630 | $56,420 | $77,210 |
| 2014 | $3,211 | $133,630 | $56,420 | $77,210 |
Map
- 6 Slocum Dr
- 97 W Main St Unit 5
- 97 W Main St Unit 10
- 47 Village Crossing Unit 47
- 11 Village Crossing Unit 11
- 46 Village Crossing Unit 46
- 5 Central Ave
- 127 Black Point Rd Unit 39
- 43 Village Crossing Unit 43
- 55 Corey Ln
- 3 Windward Dr
- 61 Terrace Ave
- 150 Black Point Rd
- 14 Old Black Point Rd
- 46 Old Black Point Rd
- 468 Main St Unit 318
- 468 Main St Unit 207
- 468 Main St Unit 111
- 468 Main St Unit 114
- 9 Columbus Ave
- 5-7 Sessa Ln
- 5 Sessa Ln
- 7 Sessa Ln
- 9 Sessa Ln Unit 11
- 104 W Main St
- 8 Sessa Ln
- 6 Sessa Ln Unit 6
- 6-8 Sessa Ln Unit 8
- 6 Sessa Ln
- 68 Sessa Ln
- 18 Sunnieside Dr
- 4 Sessa Ln
- 20 Sunnieside Dr
- 9A Huntley Ct
- 16 Sunnieside Dr
- 9 Huntley Ct
- 22 Sunnieside Dr
- 93 W Main St Unit 95
- 24 Sunnieside Dr
- 21 Sunnieside Dr
Ask me questions while you tour the home.