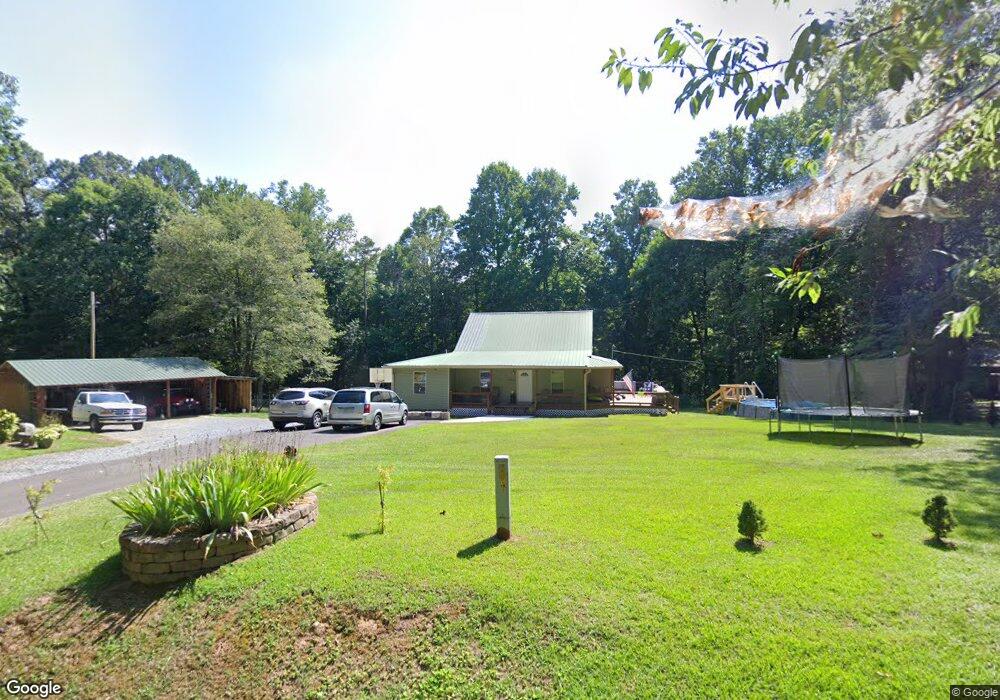
57 Shepherd Rd Ellijay, GA 30536
Estimated Value: $318,000 - $383,000
3
Beds
2
Baths
1,836
Sq Ft
$190/Sq Ft
Est. Value
About This Home
This home is located at 57 Shepherd Rd, Ellijay, GA 30536 and is currently estimated at $349,021, approximately $190 per square foot. 57 Shepherd Rd is a home located in Gilmer County with nearby schools including Ellijay Elementary School, Gilmer Middle School, and Clear Creek Elementary School.
Ownership History
Date
Name
Owned For
Owner Type
Purchase Details
Closed on
Oct 30, 2013
Sold by
Community & Southern Bank
Bought by
Stover Sue
Current Estimated Value
Home Financials for this Owner
Home Financials are based on the most recent Mortgage that was taken out on this home.
Original Mortgage
$70,000
Outstanding Balance
$51,722
Interest Rate
4.23%
Mortgage Type
New Conventional
Estimated Equity
$297,299
Purchase Details
Closed on
Apr 2, 2013
Sold by
Davenport Alan L
Bought by
Community & Southern Bank
Purchase Details
Closed on
Apr 1, 1990
Bought by
Davenport Alan Lamar
Purchase Details
Closed on
Jan 1, 1989
Bought by
Davenport Alan Lamar
Purchase Details
Closed on
Sep 1, 1973
Bought by
Davenport Alan Lamar
Create a Home Valuation Report for This Property
The Home Valuation Report is an in-depth analysis detailing your home's value as well as a comparison with similar homes in the area
Home Values in the Area
Average Home Value in this Area
Purchase History
| Date | Buyer | Sale Price | Title Company |
|---|---|---|---|
| Stover Sue | $105,100 | -- | |
| Community & Southern Bank | $62,287 | -- | |
| Davenport Alan Lamar | -- | -- | |
| Davenport Alan Lamar | -- | -- | |
| Davenport Alan Lamar | -- | -- |
Source: Public Records
Mortgage History
| Date | Status | Borrower | Loan Amount |
|---|---|---|---|
| Open | Stover Sue | $70,000 |
Source: Public Records
Tax History
| Year | Tax Paid | Tax Assessment Tax Assessment Total Assessment is a certain percentage of the fair market value that is determined by local assessors to be the total taxable value of land and additions on the property. | Land | Improvement |
|---|---|---|---|---|
| 2025 | $1,268 | $109,956 | $5,560 | $104,396 |
| 2024 | $1,281 | $108,900 | $5,280 | $103,620 |
| 2023 | $1,324 | $108,900 | $5,280 | $103,620 |
| 2022 | $1,164 | $80,200 | $5,280 | $74,920 |
| 2021 | $1,121 | $64,760 | $5,280 | $59,480 |
| 2020 | $1,235 | $64,800 | $5,280 | $59,520 |
| 2019 | $1,247 | $63,240 | $3,720 | $59,520 |
| 2018 | $1,269 | $63,480 | $3,960 | $59,520 |
| 2017 | $1,136 | $48,840 | $3,960 | $44,880 |
| 2016 | $1,170 | $49,440 | $3,960 | $45,480 |
| 2015 | $1,091 | $47,240 | $1,840 | $45,400 |
| 2014 | $1,028 | $44,000 | $1,840 | $42,160 |
| 2013 | -- | $44,000 | $1,840 | $42,160 |
Source: Public Records
Map
Nearby Homes
- L349 the Vineyard at Yukon
- 2164 Yukon Rd
- 49 Caspian Trail
- 41 Brumby Trail
- 146 Hackney Trail
- 00 Wildwood Trail
- 777 Talona Mountain Rd
- 611 Talona Mountain Rd
- 624 Talona Mountain Rd
- 201 Talona Lake Terrace
- 0 John Call Rd
- 409 Owensby Mill Dr
- Lot 34 Talona Mountain Rd Unit 34
- LOT T-5 Talona Mountain Rd
- Lot 36 Talona Mountain Rd
- Lot 34 Talona Mountain Rd
- Lot 36 Talona Mountain Rd Unit 34
- 201 Dogwood Rd
- 0 Talona Rd Unit 10652283
- 000 Talona Rd
- 57 Shepard Rd
- 57 Shepard Rd Unit 3 & 4
- 23 Shepherd Rd
- 81 Shepherd Rd
- 21 Shepherd Rd
- 2644 Yukon Rd
- 141 Shepherd Rd
- 12 Shepherd Ln
- 229 Shepherd Rd
- 2832 Yukon Rd
- 182 Shepherd Rd
- 2612 Yukon Rd
- 2649 Yukon Rd
- 63 Shepherd Ln
- 267 Shepard Rd
- 0 Bible Baptist Rd Unit 8429835
- 0 Bible Baptist Rd Unit 280697
- 0 Bible Baptist Rd Unit 5A 8279557
- 2514 Yukon Rd
- 39 Dogwood Ridge
Your Personal Tour Guide
Ask me questions while you tour the home.