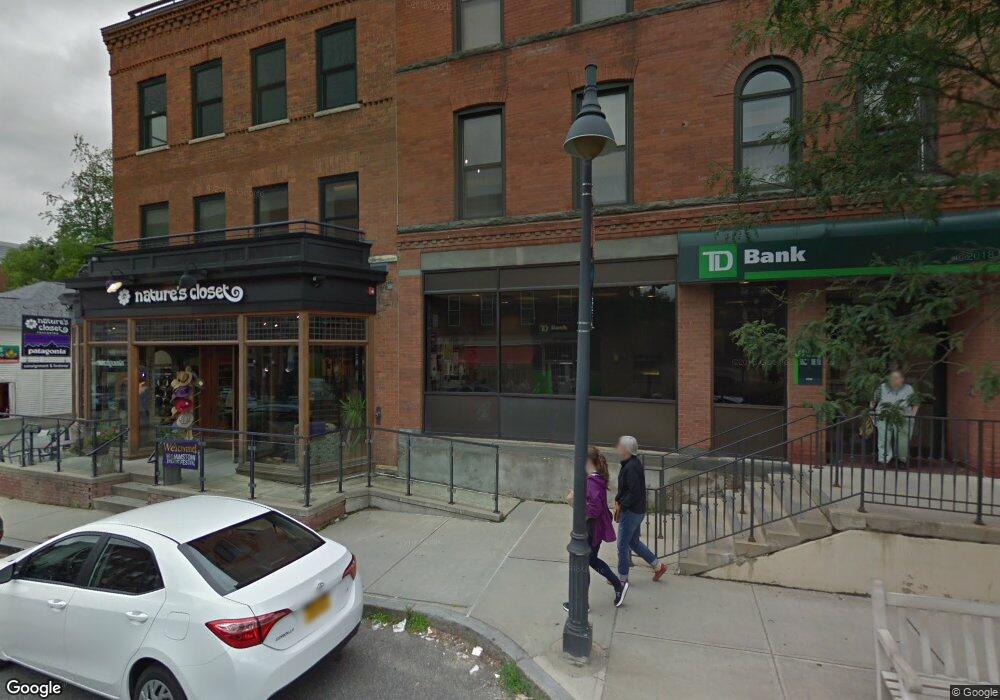
57 Spring St Williamstown, MA 01267
Estimated Value: $2,015,897
--
Bed
--
Bath
3,500
Sq Ft
$576/Sq Ft
Est. Value
About This Home
This home is located at 57 Spring St, Williamstown, MA 01267 and is currently estimated at $2,015,897, approximately $575 per square foot. 57 Spring St is a home located in Berkshire County with nearby schools including Lanesborough Elementary School, Mt. Greylock Regional High School, and Pine Cobble School.
Ownership History
Date
Name
Owned For
Owner Type
Purchase Details
Closed on
Apr 8, 2022
Sold by
57 Spring Street Inc
Bought by
Williamstown Com Invs Llc
Current Estimated Value
Home Financials for this Owner
Home Financials are based on the most recent Mortgage that was taken out on this home.
Original Mortgage
$1,400,000
Outstanding Balance
$1,321,369
Interest Rate
4.72%
Mortgage Type
Commercial
Estimated Equity
$694,528
Purchase Details
Closed on
Nov 4, 1987
Sold by
First Serv Bk Svgs
Bought by
57 Spring St Inc
Home Financials for this Owner
Home Financials are based on the most recent Mortgage that was taken out on this home.
Original Mortgage
$1,020,000
Interest Rate
10.97%
Mortgage Type
Commercial
Create a Home Valuation Report for This Property
The Home Valuation Report is an in-depth analysis detailing your home's value as well as a comparison with similar homes in the area
Home Values in the Area
Average Home Value in this Area
Purchase History
| Date | Buyer | Sale Price | Title Company |
|---|---|---|---|
| Williamstown Com Invs Llc | $1,750,000 | None Available | |
| 57 Spring St Inc | $420,000 | -- |
Source: Public Records
Mortgage History
| Date | Status | Borrower | Loan Amount |
|---|---|---|---|
| Open | Williamstown Com Invs Llc | $1,400,000 | |
| Previous Owner | 57 Spring St Inc | $880,000 | |
| Previous Owner | 57 Spring St Inc | $250,000 | |
| Previous Owner | 57 Spring St Inc | $1,020,000 |
Source: Public Records
Tax History Compared to Growth
Tax History
| Year | Tax Paid | Tax Assessment Tax Assessment Total Assessment is a certain percentage of the fair market value that is determined by local assessors to be the total taxable value of land and additions on the property. | Land | Improvement |
|---|---|---|---|---|
| 2025 | $24,691 | $1,789,200 | $202,700 | $1,586,500 |
| 2024 | $20,789 | $1,372,200 | $193,300 | $1,178,900 |
| 2023 | $22,188 | $1,372,200 | $193,300 | $1,178,900 |
| 2022 | $20,062 | $1,185,700 | $185,900 | $999,800 |
| 2021 | $22,468 | $1,298,700 | $185,900 | $1,112,800 |
| 2020 | $24,920 | $1,415,900 | $186,100 | $1,229,800 |
| 2019 | $24,979 | $1,383,900 | $152,900 | $1,231,000 |
| 2018 | $24,827 | $1,383,900 | $152,900 | $1,231,000 |
| 2017 | $23,582 | $1,383,900 | $152,900 | $1,231,000 |
| 2016 | $21,852 | $1,383,900 | $152,900 | $1,231,000 |
| 2015 | $21,603 | $1,383,900 | $152,900 | $1,231,000 |
| 2014 | $21,346 | $1,397,000 | $175,300 | $1,221,700 |
Source: Public Records
Map
Nearby Homes
- 1 River Run Unit 1
- 2 River Run
- 2 River Run Rd
- 160 Water St Unit 102
- 160 Water St Unit 407
- 160 Water St Unit 112
- 160 Water St Unit 23
- 160 Water St Unit 103
- 160 Water St Unit 209
- 160 Water St Unit 309
- 196 South St
- 12 River Run
- 111 Park St
- 111 North St
- 0 Northwest Hill
- 34 Jerome Dr
- 0 Water St
- 193 Cold Spring Rd
- 116 Buxton Hill Rd
- 51 Colonial Ave