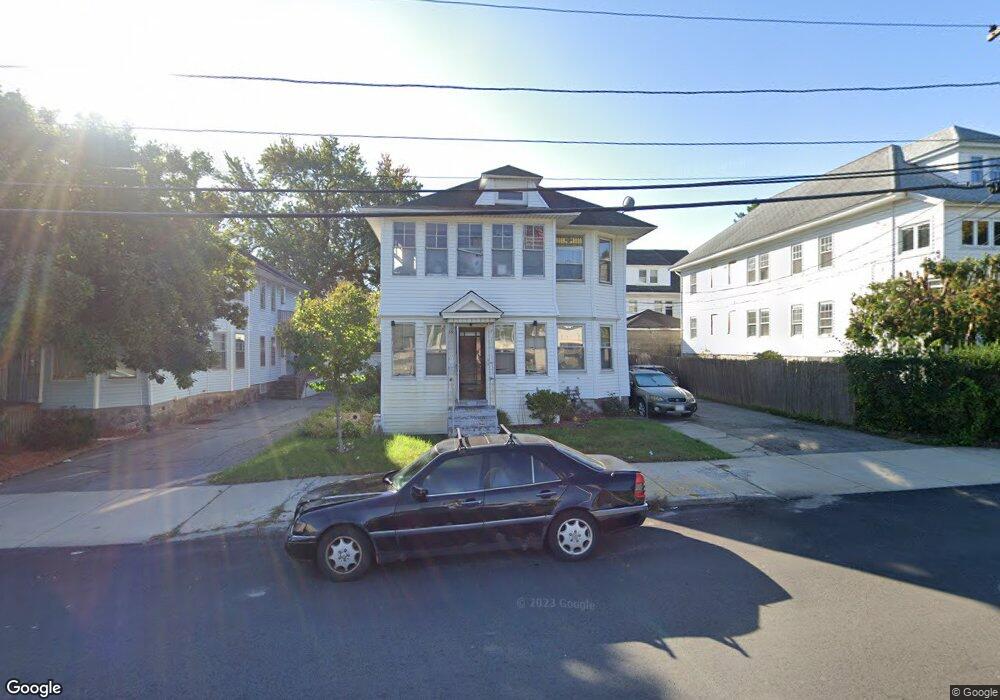
57 Swan St Unit 59 Lawrence, MA 01841
Prospect Hill-Back Bay NeighborhoodEstimated Value: $665,230 - $784,000
4
Beds
2
Baths
2,904
Sq Ft
$250/Sq Ft
Est. Value
About This Home
This home is located at 57 Swan St Unit 59, Lawrence, MA 01841 and is currently estimated at $725,058, approximately $249 per square foot. 57 Swan St Unit 59 is a home located in Essex County with nearby schools including School For Exceptional Studies, Community Day Charter Public School - Gateway, and Esperanza Academy School of Hope.
Ownership History
Date
Name
Owned For
Owner Type
Purchase Details
Closed on
Mar 15, 2005
Sold by
Dizoglio Julie A
Bought by
Morales Edwin H and Morataya Irma Y
Current Estimated Value
Home Financials for this Owner
Home Financials are based on the most recent Mortgage that was taken out on this home.
Original Mortgage
$330,000
Outstanding Balance
$167,634
Interest Rate
5.64%
Mortgage Type
Purchase Money Mortgage
Estimated Equity
$557,424
Purchase Details
Closed on
Aug 29, 2002
Sold by
Est Saunders Sylvia and Podesta-Raifstanger M
Bought by
Dizoglio Julie A
Home Financials for this Owner
Home Financials are based on the most recent Mortgage that was taken out on this home.
Original Mortgage
$130,400
Interest Rate
6.55%
Mortgage Type
Purchase Money Mortgage
Create a Home Valuation Report for This Property
The Home Valuation Report is an in-depth analysis detailing your home's value as well as a comparison with similar homes in the area
Home Values in the Area
Average Home Value in this Area
Purchase History
| Date | Buyer | Sale Price | Title Company |
|---|---|---|---|
| Morales Edwin H | $330,000 | -- | |
| Dizoglio Julie A | $163,000 | -- |
Source: Public Records
Mortgage History
| Date | Status | Borrower | Loan Amount |
|---|---|---|---|
| Open | Morales Edwin H | $330,000 | |
| Previous Owner | Dizoglio Julie A | $130,400 |
Source: Public Records
Tax History Compared to Growth
Tax History
| Year | Tax Paid | Tax Assessment Tax Assessment Total Assessment is a certain percentage of the fair market value that is determined by local assessors to be the total taxable value of land and additions on the property. | Land | Improvement |
|---|---|---|---|---|
| 2025 | $5,776 | $656,400 | $132,600 | $523,800 |
| 2024 | $4,927 | $532,700 | $98,100 | $434,600 |
| 2023 | $5,199 | $511,700 | $95,700 | $416,000 |
| 2022 | $4,962 | $433,700 | $95,700 | $338,000 |
| 2021 | $5,379 | $438,400 | $95,700 | $342,700 |
| 2020 | $5,301 | $426,500 | $86,000 | $340,500 |
| 2019 | $4,751 | $347,300 | $77,300 | $270,000 |
| 2018 | $4,345 | $303,400 | $66,500 | $236,900 |
| 2017 | $4,128 | $269,100 | $65,700 | $203,400 |
| 2016 | $3,822 | $246,400 | $48,000 | $198,400 |
| 2015 | $3,524 | $233,100 | $48,000 | $185,100 |
Source: Public Records
Map
Nearby Homes
- 20 Knox St Unit 43
- 20 Knox St Unit 23
- 6 Longwood Dr
- 169 Berkeley St
- 183 Berkeley St
- 7 Magnolia Rd
- 129-131 Lexington St
- 24 Boylston St
- 35 Kendall St
- 24 Court St
- 15 Swan Ave
- 100-102 E Haverhill St
- 9 Boylston St
- 35 Swan Ave
- 167 Ferry 53 Mann St Unit 2,5,6
- 5 Arlington Terrace
- 63 Lippold St
- 65 Brook St
- 68 Wesley St
- 83 Oakside Ave
- 61 Swan St Unit 63
- 55 A&B Swan St
- 55A Swan St Unit B
- 65 Swan St Unit 67
- 37 Cornish St Unit 39
- 44 Swan St
- 69 Swan St Unit 71
- 53 Swan St Unit 55
- 53-55 Swan St
- 33 Cornish St Unit 35
- 73 Swan St
- 40 Swan St
- 44 Montgomery St
- 44 Cornish St Unit 46
- 51 Swan St Unit 51A
- 4 Cornish Street Extension
- 36 Montgomery St
- 48 Montgomery St
- 40 Cornish St Unit 42
- 3 Cornish Street Extension