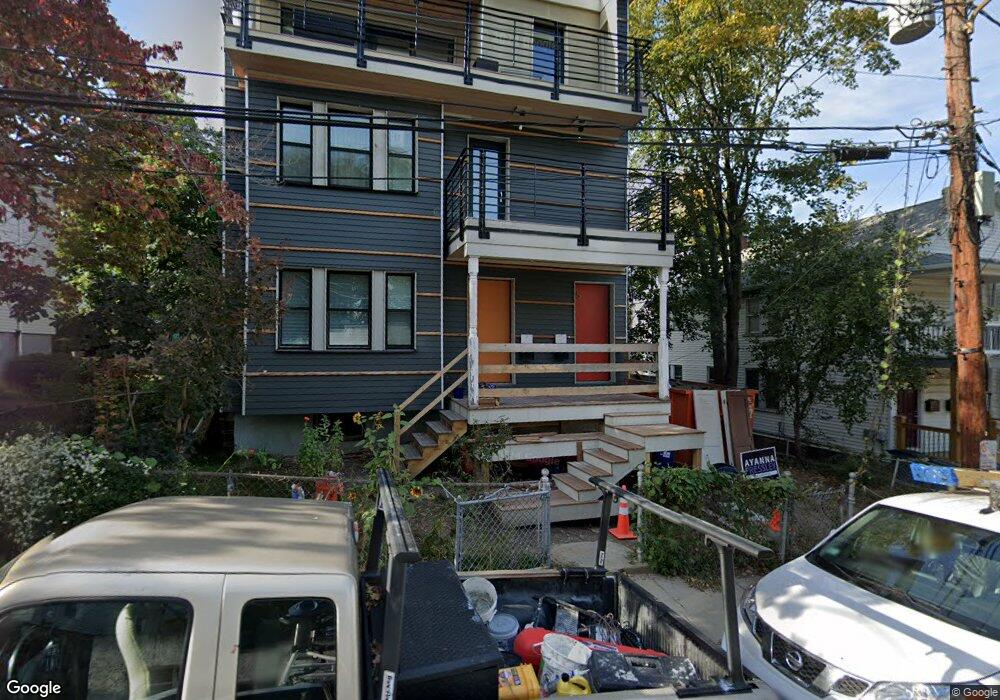
57 Thornton St Roxbury, MA 02119
Fort Hill NeighborhoodEstimated Value: $1,031,000 - $1,169,400
5
Beds
3
Baths
2,716
Sq Ft
$394/Sq Ft
Est. Value
About This Home
This home is located at 57 Thornton St, Roxbury, MA 02119 and is currently estimated at $1,070,600, approximately $394 per square foot. 57 Thornton St is a home located in Suffolk County with nearby schools including City on a Hill Charter Public School and Paige Academy.
Ownership History
Date
Name
Owned For
Owner Type
Purchase Details
Closed on
Jul 15, 2010
Sold by
Petty-Edwards Lula and Burton Martha J
Bought by
Wood Joshua and Breen Jennifer
Current Estimated Value
Home Financials for this Owner
Home Financials are based on the most recent Mortgage that was taken out on this home.
Original Mortgage
$204,000
Outstanding Balance
$136,237
Interest Rate
4.82%
Mortgage Type
Purchase Money Mortgage
Estimated Equity
$934,363
Create a Home Valuation Report for This Property
The Home Valuation Report is an in-depth analysis detailing your home's value as well as a comparison with similar homes in the area
Home Values in the Area
Average Home Value in this Area
Purchase History
| Date | Buyer | Sale Price | Title Company |
|---|---|---|---|
| Wood Joshua | $255,000 | -- | |
| Wood Joshua | $255,000 | -- |
Source: Public Records
Mortgage History
| Date | Status | Borrower | Loan Amount |
|---|---|---|---|
| Open | Wood Joshua | $204,000 | |
| Closed | Wood Joshua | $204,000 |
Source: Public Records
Tax History Compared to Growth
Tax History
| Year | Tax Paid | Tax Assessment Tax Assessment Total Assessment is a certain percentage of the fair market value that is determined by local assessors to be the total taxable value of land and additions on the property. | Land | Improvement |
|---|---|---|---|---|
| 2025 | $11,111 | $959,500 | $333,400 | $626,100 |
| 2024 | $9,628 | $883,300 | $231,600 | $651,700 |
| 2023 | $8,028 | $747,500 | $196,000 | $551,500 |
| 2022 | $6,366 | $585,100 | $202,400 | $382,700 |
| 2021 | $5,834 | $546,800 | $189,200 | $357,600 |
| 2020 | $5,314 | $503,200 | $181,400 | $321,800 |
| 2019 | $4,959 | $470,500 | $138,900 | $331,600 |
| 2018 | $4,567 | $435,800 | $138,900 | $296,900 |
| 2017 | $4,571 | $431,600 | $138,900 | $292,700 |
| 2016 | $3,518 | $319,799 | $115,287 | $204,512 |
| 2015 | $3,279 | $270,800 | $101,600 | $169,200 |
| 2014 | $3,097 | $246,200 | $101,600 | $144,600 |
Source: Public Records
Map
Nearby Homes
- 38 Juniper St
- 9 W Cedar St Unit 1
- 31 Dorr St
- 51 Saint James St
- 49 Norfolk St
- 37 Regent St Unit 2
- 10 Linwood St
- 27 Dudley St
- 4 Fort Ave Unit 2
- 63 Beech Glen St
- 51 Beech Glen St Unit 3
- 9-45 Vale St
- 59 Fort Ave
- 94 Walnut Ave
- 22 Rockville Park
- 20 Rockville Park
- 1 Centre Street Terrace Unit 7
- 16 Mayfair St
- 2856 Washington St
- 8 Brinton St Unit 2
- 5-7 Thornton St
- 9 Thornton St Unit 11
- 13 Thornton St
- 1 Thornton St Unit 1
- 3 Thornton St Unit 3
- 14 Rockledge St Unit 16
- 14 Rockledge St Unit 1
- 14 Rockledge St
- 32 Guild St Unit 34
- 32 Guild St Unit 1
- 34 Guild St Unit 1
- 12 Thornton St
- 49 Juniper St
- 19 Thornton St
- 19 Thornton St Unit 1
- 12 Rockledge St Unit 1
- 10 Rockledge St Unit 12
- 47 Juniper St
- 36 Guild St Unit 38
- 23 Rockledge St Unit 1