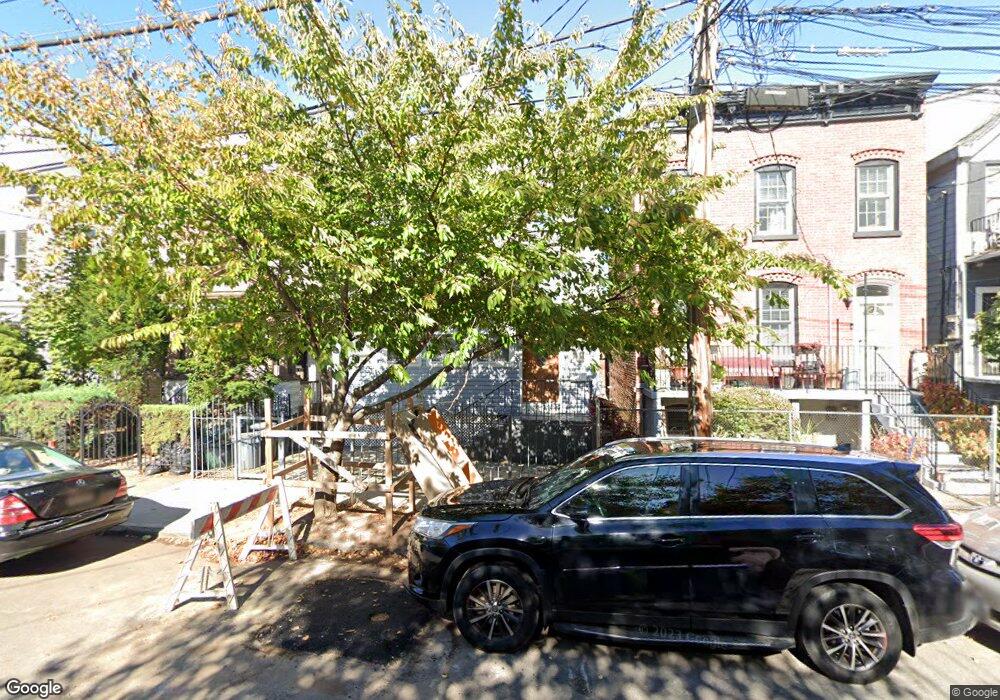
57 Tompkins St Unit 1 Staten Island, NY 10304
Stapleton NeighborhoodEstimated Value: $543,158 - $600,000
5
Beds
2
Baths
1,522
Sq Ft
$368/Sq Ft
Est. Value
About This Home
This home is located at 57 Tompkins St Unit 1, Staten Island, NY 10304 and is currently estimated at $560,790, approximately $368 per square foot. 57 Tompkins St Unit 1 is a home located in Richmond County with nearby schools including P.S. 78, P.S./I.S. 78Q Early Childhood Center, and I.S. 49 Berta A Dreyfus.
Ownership History
Date
Name
Owned For
Owner Type
Purchase Details
Closed on
Dec 15, 2020
Sold by
Rosario Carlos
Bought by
Rijo Carlos A
Current Estimated Value
Home Financials for this Owner
Home Financials are based on the most recent Mortgage that was taken out on this home.
Original Mortgage
$430,000
Outstanding Balance
$382,897
Interest Rate
2.71%
Mortgage Type
New Conventional
Estimated Equity
$177,893
Purchase Details
Closed on
Jan 21, 2003
Sold by
Brown Leslie
Bought by
Rosario Carlos
Home Financials for this Owner
Home Financials are based on the most recent Mortgage that was taken out on this home.
Original Mortgage
$166,500
Interest Rate
8.65%
Mortgage Type
Purchase Money Mortgage
Purchase Details
Closed on
May 7, 1998
Sold by
Olivo Michael and Olivo Anne
Bought by
Brown Leslie
Create a Home Valuation Report for This Property
The Home Valuation Report is an in-depth analysis detailing your home's value as well as a comparison with similar homes in the area
Home Values in the Area
Average Home Value in this Area
Purchase History
| Date | Buyer | Sale Price | Title Company |
|---|---|---|---|
| Rijo Carlos A | $460,000 | Chicago Title | |
| Rosario Carlos | $185,000 | Regal Title | |
| Brown Leslie | $113,500 | First American Title Ins Co |
Source: Public Records
Mortgage History
| Date | Status | Borrower | Loan Amount |
|---|---|---|---|
| Open | Rijo Carlos A | $430,000 | |
| Previous Owner | Rosario Carlos | $166,500 |
Source: Public Records
Tax History Compared to Growth
Tax History
| Year | Tax Paid | Tax Assessment Tax Assessment Total Assessment is a certain percentage of the fair market value that is determined by local assessors to be the total taxable value of land and additions on the property. | Land | Improvement |
|---|---|---|---|---|
| 2025 | $4,175 | $27,360 | $4,687 | $22,673 |
| 2024 | $4,175 | $22,380 | $5,406 | $16,974 |
| 2023 | $3,983 | $19,613 | $4,314 | $15,299 |
| 2022 | $3,915 | $26,220 | $5,820 | $20,400 |
| 2021 | $4,096 | $24,780 | $5,820 | $18,960 |
| 2020 | $3,591 | $23,640 | $5,820 | $17,820 |
| 2019 | $3,331 | $25,680 | $5,820 | $19,860 |
| 2018 | $3,034 | $16,344 | $4,863 | $11,481 |
| 2017 | $3,032 | $16,344 | $4,690 | $11,654 |
| 2016 | $2,933 | $16,221 | $4,287 | $11,934 |
| 2015 | $2,466 | $15,303 | $3,802 | $11,501 |
| 2014 | $2,466 | $14,437 | $4,299 | $10,138 |
Source: Public Records
Map
Nearby Homes
- 64 Tompkins St
- 40 Tompkins St
- 49 Tompkins Cir
- 34 Broad St
- 191 Canal St
- 75 Thompson St
- 19 Broad St
- 66 Tappen Ct
- 684 Bay St
- 25 Tappen Ct
- 0 Broad St Unit 2400974
- 0 Broad St Unit 11250971
- 0 Broad St Unit 2400973
- 0 Broad St Unit 1150314
- 181 Broad St
- 20 Tappen Ct
- 16 Cedar St
- 163 Boyd St
- 24 Hudson St
- 12 Court St