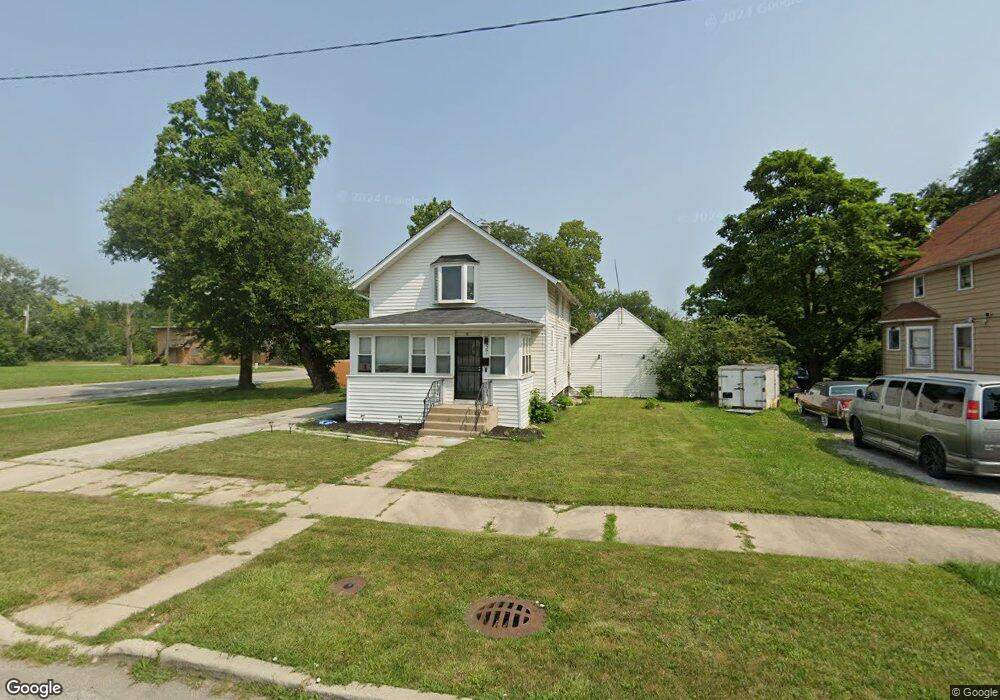
57 W 150th St Harvey, IL 60426
Estimated Value: $88,000 - $133,000
4
Beds
2
Baths
720
Sq Ft
$144/Sq Ft
Est. Value
About This Home
This home is located at 57 W 150th St, Harvey, IL 60426 and is currently estimated at $103,698, approximately $144 per square foot. 57 W 150th St is a home located in Cook County with nearby schools including Thornton Township High School.
Ownership History
Date
Name
Owned For
Owner Type
Purchase Details
Closed on
Jul 2, 2008
Sold by
Nixon Renee and Nixon Renee E
Bought by
Wells Fargo Bank Na
Current Estimated Value
Purchase Details
Closed on
Jul 11, 2006
Sold by
Pledged Property Ii Llc
Bought by
Nixon Renee E
Home Financials for this Owner
Home Financials are based on the most recent Mortgage that was taken out on this home.
Original Mortgage
$104,000
Interest Rate
9.75%
Mortgage Type
Purchase Money Mortgage
Purchase Details
Closed on
Mar 23, 2006
Sold by
Rodgers Samuel and Rogers Samuel
Bought by
Jp Morgan Chase Bank and The Home Equity Loan Asset Backed Certif
Purchase Details
Closed on
Aug 28, 1997
Sold by
Gassaway Ronald D
Bought by
Rodgers Samuel
Home Financials for this Owner
Home Financials are based on the most recent Mortgage that was taken out on this home.
Original Mortgage
$52,337
Interest Rate
7.44%
Create a Home Valuation Report for This Property
The Home Valuation Report is an in-depth analysis detailing your home's value as well as a comparison with similar homes in the area
Home Values in the Area
Average Home Value in this Area
Purchase History
| Date | Buyer | Sale Price | Title Company |
|---|---|---|---|
| Wells Fargo Bank Na | -- | First American Title | |
| Nixon Renee E | $69,900 | Chicago Title | |
| Pledged Property Ii Llc | -- | Chicago Title | |
| Jp Morgan Chase Bank | -- | None Available | |
| Rodgers Samuel | $26,000 | -- |
Source: Public Records
Mortgage History
| Date | Status | Borrower | Loan Amount |
|---|---|---|---|
| Previous Owner | Pledged Property Ii Llc | $104,000 | |
| Previous Owner | Rodgers Samuel | $52,337 |
Source: Public Records
Tax History Compared to Growth
Tax History
| Year | Tax Paid | Tax Assessment Tax Assessment Total Assessment is a certain percentage of the fair market value that is determined by local assessors to be the total taxable value of land and additions on the property. | Land | Improvement |
|---|---|---|---|---|
| 2024 | $1,549 | $5,500 | $956 | $4,544 |
| 2023 | $526 | $5,500 | $956 | $4,544 |
| 2022 | $526 | $4,030 | $956 | $3,074 |
| 2021 | $591 | $4,028 | $955 | $3,073 |
| 2020 | $761 | $4,028 | $955 | $3,073 |
| 2019 | $290 | $3,787 | $868 | $2,919 |
| 2018 | $276 | $3,787 | $868 | $2,919 |
| 2017 | $318 | $3,787 | $868 | $2,919 |
| 2016 | $624 | $3,360 | $781 | $2,579 |
| 2015 | $512 | $3,360 | $781 | $2,579 |
| 2014 | $547 | $3,360 | $781 | $2,579 |
| 2013 | $965 | $4,144 | $781 | $3,363 |
Source: Public Records
Map
Nearby Homes
- 15033 Paulina St
- 15032 Marshfield Ave
- 14911 Page Ave
- 14910 S Wood St
- 110 W 150th St
- 14900 Vine Ave
- 14921 Lincoln Ave
- 14807 Paulina St
- 36 E 151st St
- 15018 Myrtle Ave
- 15032 Winchester Ave
- 147 W 150th St
- 15131 Winchester Ave
- 14727 Wood St
- 15231 Ashland Ave
- 15240 Ashland Ave
- 14806 Lincoln Ave
- 15025 Loomis Ave
- 14826 Robey Ave
- 15012 Seeley Ave
- 57 W 150th St
- 53 W 150th St
- 14937 Page Ave
- 14937 Page Ave
- 49 W 150th St
- 14932 Paulina St
- 14934 Paulina St
- 14928 Paulina St
- 50 W 150th St
- 50 W 150th St
- 14924 Page Ave
- 46 W 150th St
- 39 W 150th St
- 39 W 150th St
- 14920 Paulina St
- 15000 Paulina St
- 15000 Paulina St
- 70 W 150th St
- 14915 Page Ave
- 14915 Page Ave