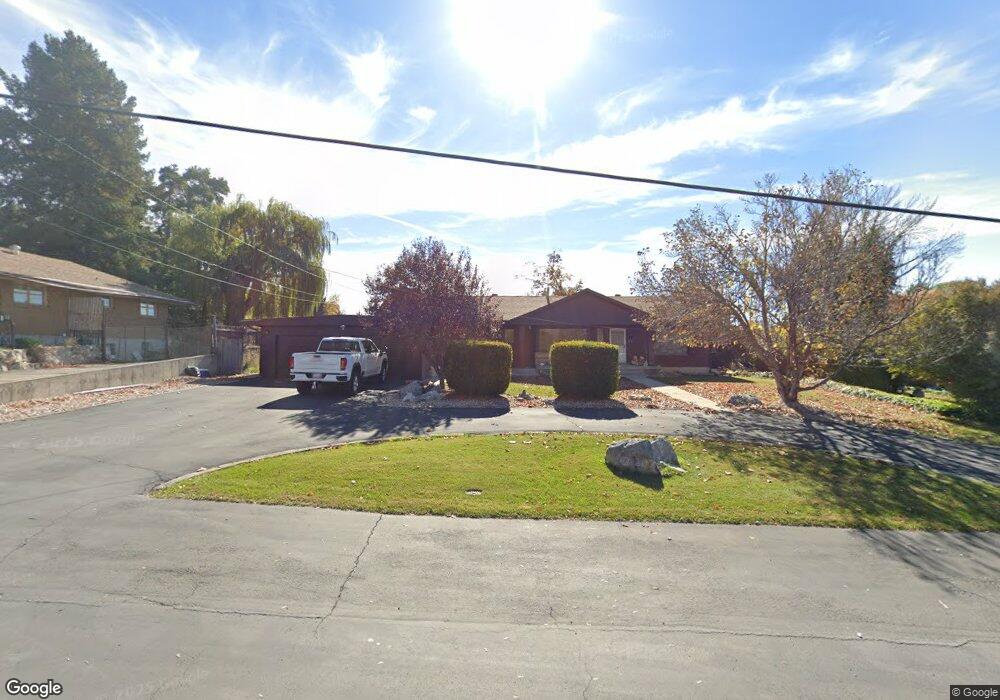
57 W 400 N Lindon, UT 84042
Estimated Value: $612,000 - $762,229
6
Beds
3
Baths
3,060
Sq Ft
$222/Sq Ft
Est. Value
About This Home
This home is located at 57 W 400 N, Lindon, UT 84042 and is currently estimated at $678,807, approximately $221 per square foot. 57 W 400 N is a home located in Utah County with nearby schools including Lindon Elementary School, Oak Canyon Junior High School, and Pleasant Grove High School.
Ownership History
Date
Name
Owned For
Owner Type
Purchase Details
Closed on
Dec 24, 2012
Sold by
Centernial Tracking Co I Inc
Bought by
Anderson Maryanne C
Current Estimated Value
Purchase Details
Closed on
Oct 3, 2003
Sold by
Lott Del and Lott Marlys P
Bought by
Ferron Ernesto O and Ferron Katrina M
Home Financials for this Owner
Home Financials are based on the most recent Mortgage that was taken out on this home.
Original Mortgage
$180,000
Interest Rate
8.5%
Mortgage Type
Purchase Money Mortgage
Purchase Details
Closed on
Nov 15, 1999
Sold by
Greenwood Noal Thomas and Greenwood Claudine B
Bought by
Lott Del
Home Financials for this Owner
Home Financials are based on the most recent Mortgage that was taken out on this home.
Original Mortgage
$169,200
Interest Rate
4.95%
Create a Home Valuation Report for This Property
The Home Valuation Report is an in-depth analysis detailing your home's value as well as a comparison with similar homes in the area
Home Values in the Area
Average Home Value in this Area
Purchase History
We collect this data history from publicly available records. To have your information removed, we recommend requesting removal directly through your county’s website.
| Date | Buyer | Sale Price | Title Company |
|---|---|---|---|
| Anderson Maryanne C | -- | None Available | |
| Ferron Ernesto O | -- | Access Title Company | |
| Lott Del | -- | Security Title & Abstract | |
| Lott Del | -- | Security Title & Abstract |
Source: Public Records
Mortgage History
We collect this data history from publicly available records. To have your information removed, we recommend requesting removal directly through your county’s website.
| Date | Status | Borrower | Loan Amount |
|---|---|---|---|
| Previous Owner | Ferron Ernesto O | $180,000 | |
| Previous Owner | Lott Del | $169,200 | |
| Closed | Ferron Ernesto O | $6,500 |
Source: Public Records
Tax History
| Year | Tax Paid | Tax Assessment Tax Assessment Total Assessment is a certain percentage of the fair market value that is determined by local assessors to be the total taxable value of land and additions on the property. | Land | Improvement |
|---|---|---|---|---|
| 2025 | $2,677 | $365,365 | -- | -- |
| 2024 | $2,677 | $330,055 | $0 | $0 |
| 2023 | $2,512 | $332,640 | $0 | $0 |
| 2022 | $2,563 | $327,855 | $0 | $0 |
| 2021 | $2,154 | $415,400 | $213,900 | $201,500 |
| 2020 | $2,007 | $381,100 | $191,000 | $190,100 |
| 2019 | $1,702 | $337,200 | $163,700 | $173,500 |
| 2018 | $1,708 | $319,000 | $145,500 | $173,500 |
| 2017 | $1,628 | $162,965 | $0 | $0 |
| 2016 | $1,544 | $143,000 | $0 | $0 |
| 2015 | $1,509 | $132,165 | $0 | $0 |
| 2014 | $1,300 | $112,750 | $0 | $0 |
Source: Public Records
Map
Nearby Homes
Your Personal Tour Guide
Ask me questions while you tour the home.