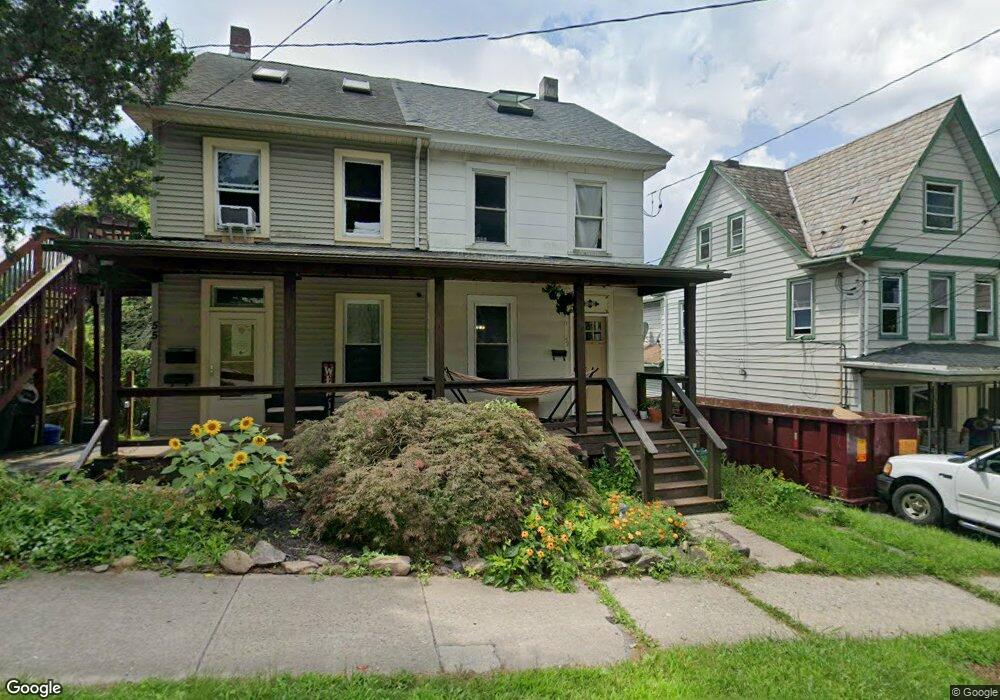
57 W Front St Jim Thorpe, PA 18229
Estimated Value: $154,280 - $225,000
3
Beds
1
Bath
1,320
Sq Ft
$144/Sq Ft
Est. Value
About This Home
This home is located at 57 W Front St, Jim Thorpe, PA 18229 and is currently estimated at $189,570, approximately $143 per square foot. 57 W Front St is a home located in Carbon County with nearby schools including Jim Thorpe Area High School and Sts. Peter & Paul School.
Ownership History
Date
Name
Owned For
Owner Type
Purchase Details
Closed on
Mar 9, 2018
Sold by
Benson Robert W and Benson Linda L
Bought by
Hennegan William J and Zito Jacqueline
Current Estimated Value
Home Financials for this Owner
Home Financials are based on the most recent Mortgage that was taken out on this home.
Original Mortgage
$63,555
Outstanding Balance
$36,872
Interest Rate
4.32%
Mortgage Type
New Conventional
Estimated Equity
$152,698
Purchase Details
Closed on
Mar 23, 2007
Sold by
Moyer Todd A
Bought by
Benson Robert W and Benson Linda L
Create a Home Valuation Report for This Property
The Home Valuation Report is an in-depth analysis detailing your home's value as well as a comparison with similar homes in the area
Home Values in the Area
Average Home Value in this Area
Purchase History
| Date | Buyer | Sale Price | Title Company |
|---|---|---|---|
| Hennegan William J | $66,900 | None Available | |
| Benson Robert W | -- | None Available |
Source: Public Records
Mortgage History
| Date | Status | Borrower | Loan Amount |
|---|---|---|---|
| Open | Hennegan William J | $63,555 |
Source: Public Records
Tax History Compared to Growth
Tax History
| Year | Tax Paid | Tax Assessment Tax Assessment Total Assessment is a certain percentage of the fair market value that is determined by local assessors to be the total taxable value of land and additions on the property. | Land | Improvement |
|---|---|---|---|---|
| 2025 | $2,016 | $25,400 | $7,400 | $18,000 |
| 2024 | $1,940 | $25,400 | $7,400 | $18,000 |
| 2023 | $1,904 | $25,400 | $7,400 | $18,000 |
| 2022 | $1,874 | $25,400 | $7,400 | $18,000 |
| 2021 | $1,874 | $25,400 | $7,400 | $18,000 |
| 2020 | $1,809 | $25,400 | $7,400 | $18,000 |
| 2019 | $1,758 | $25,400 | $7,400 | $18,000 |
| 2018 | $1,719 | $25,400 | $7,400 | $18,000 |
| 2017 | $1,668 | $25,400 | $7,400 | $18,000 |
| 2016 | -- | $25,400 | $7,400 | $18,000 |
| 2015 | -- | $25,400 | $7,400 | $18,000 |
| 2014 | -- | $25,400 | $7,400 | $18,000 |
Source: Public Records
Map
Nearby Homes