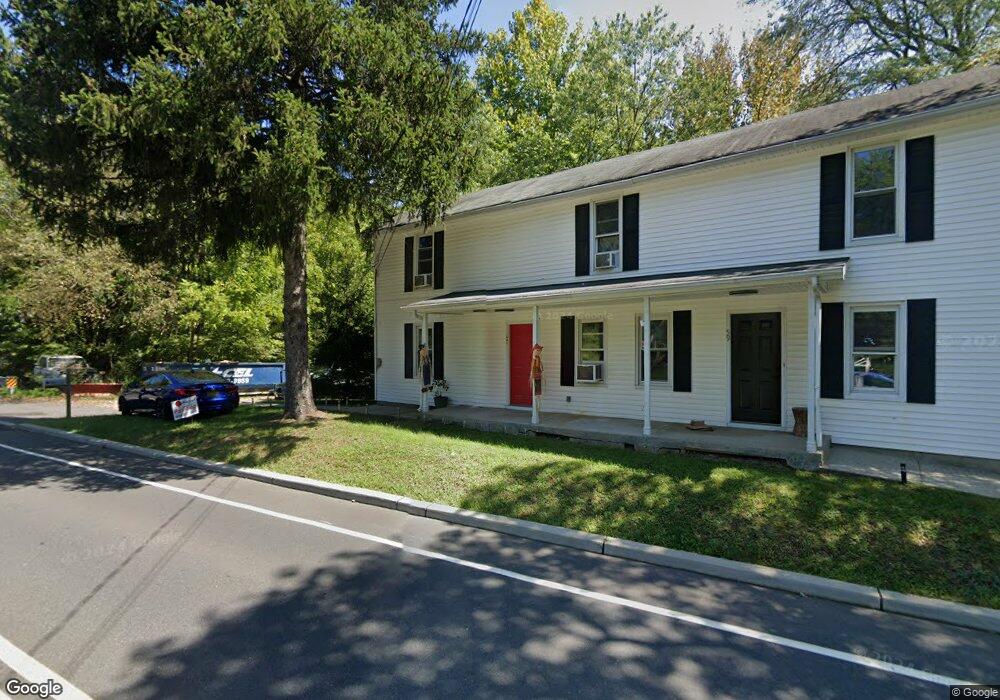
57 W Main St Unit 59 High Bridge, NJ 08829
Estimated Value: $487,000 - $557,000
--
Bed
--
Bath
2,552
Sq Ft
$205/Sq Ft
Est. Value
About This Home
This home is located at 57 W Main St Unit 59, High Bridge, NJ 08829 and is currently estimated at $523,812, approximately $205 per square foot. 57 W Main St Unit 59 is a home located in Hunterdon County with nearby schools including High Bridge Elementary School, High Bridge Middle School, and Voorhees High School.
Ownership History
Date
Name
Owned For
Owner Type
Purchase Details
Closed on
Jul 16, 2018
Sold by
Richardson Jonathan and Richardson Cheverly A
Bought by
Alvarado Neliz Ervin A
Current Estimated Value
Home Financials for this Owner
Home Financials are based on the most recent Mortgage that was taken out on this home.
Original Mortgage
$237,500
Outstanding Balance
$205,829
Interest Rate
4.5%
Mortgage Type
New Conventional
Estimated Equity
$317,983
Purchase Details
Closed on
Jun 5, 1997
Sold by
Brong Stanley
Bought by
Richardson Jonathan and Richardson Cheverly A
Create a Home Valuation Report for This Property
The Home Valuation Report is an in-depth analysis detailing your home's value as well as a comparison with similar homes in the area
Home Values in the Area
Average Home Value in this Area
Purchase History
| Date | Buyer | Sale Price | Title Company |
|---|---|---|---|
| Alvarado Neliz Ervin A | $250,000 | Acres Land Title Agency Inc | |
| Richardson Jonathan | $62,500 | -- |
Source: Public Records
Mortgage History
| Date | Status | Borrower | Loan Amount |
|---|---|---|---|
| Open | Alvarado Neliz Ervin A | $237,500 |
Source: Public Records
Tax History Compared to Growth
Tax History
| Year | Tax Paid | Tax Assessment Tax Assessment Total Assessment is a certain percentage of the fair market value that is determined by local assessors to be the total taxable value of land and additions on the property. | Land | Improvement |
|---|---|---|---|---|
| 2025 | $12,015 | $381,100 | $111,000 | $270,100 |
| 2024 | $10,375 | $368,100 | $101,000 | $267,100 |
| 2023 | $10,375 | $262,400 | $87,000 | $175,400 |
| 2022 | $10,586 | $248,800 | $73,400 | $175,400 |
| 2021 | $10,241 | $247,900 | $73,400 | $174,500 |
| 2020 | $10,164 | $247,900 | $73,400 | $174,500 |
| 2019 | $10,241 | $247,900 | $73,400 | $174,500 |
| 2018 | $10,938 | $276,000 | $76,500 | $199,500 |
| 2017 | $10,637 | $276,000 | $76,500 | $199,500 |
| 2016 | $10,513 | $276,000 | $76,500 | $199,500 |
| 2015 | $10,229 | $276,000 | $76,500 | $199,500 |
| 2014 | $10,592 | $308,900 | $147,000 | $161,900 |
Source: Public Records
Map
Nearby Homes