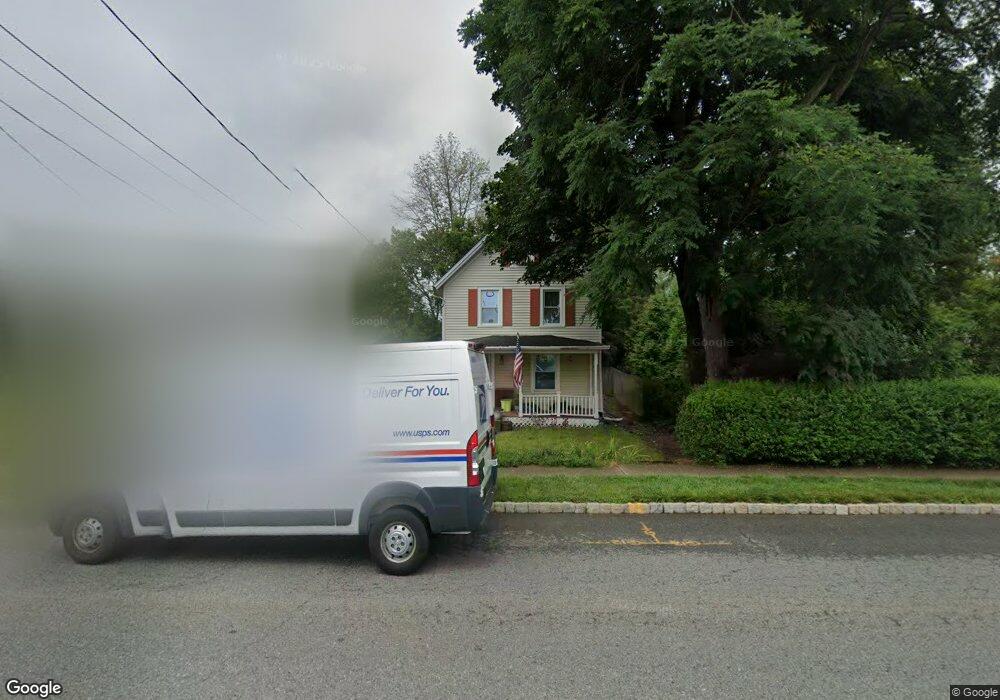
57 W Main St Mendham, NJ 07945
Estimated Value: $1,597,643 - $1,633,000
--
Bed
--
Bath
5,006
Sq Ft
$324/Sq Ft
Est. Value
About This Home
This home is located at 57 W Main St, Mendham, NJ 07945 and is currently estimated at $1,620,411, approximately $323 per square foot. 57 W Main St is a home located in Morris County with nearby schools including Hilltop Elementary School, Mountain View Middle School, and West Morris Mendham High School.
Ownership History
Date
Name
Owned For
Owner Type
Purchase Details
Closed on
Apr 19, 2001
Sold by
Logie John
Bought by
Yakimischak Dave and Yakimischak Joan
Current Estimated Value
Home Financials for this Owner
Home Financials are based on the most recent Mortgage that was taken out on this home.
Original Mortgage
$495,000
Outstanding Balance
$180,165
Interest Rate
6.85%
Estimated Equity
$1,440,246
Purchase Details
Closed on
Sep 26, 2000
Sold by
Logie Ellen L
Bought by
Logie Priscilla L and Logie John R
Create a Home Valuation Report for This Property
The Home Valuation Report is an in-depth analysis detailing your home's value as well as a comparison with similar homes in the area
Home Values in the Area
Average Home Value in this Area
Purchase History
| Date | Buyer | Sale Price | Title Company |
|---|---|---|---|
| Yakimischak Dave | $550,000 | -- | |
| Logie Priscilla L | -- | -- |
Source: Public Records
Mortgage History
| Date | Status | Borrower | Loan Amount |
|---|---|---|---|
| Open | Yakimischak Dave | $495,000 |
Source: Public Records
Tax History Compared to Growth
Tax History
| Year | Tax Paid | Tax Assessment Tax Assessment Total Assessment is a certain percentage of the fair market value that is determined by local assessors to be the total taxable value of land and additions on the property. | Land | Improvement |
|---|---|---|---|---|
| 2025 | $22,255 | $1,316,300 | $475,000 | $841,300 |
| 2024 | $21,312 | $1,146,000 | $441,300 | $704,700 |
| 2023 | $21,312 | $1,020,200 | $373,800 | $646,400 |
| 2022 | $20,977 | $994,000 | $363,800 | $630,200 |
| 2021 | $20,977 | $947,900 | $337,500 | $610,400 |
| 2020 | $20,844 | $947,900 | $337,500 | $610,400 |
| 2019 | $20,456 | $947,900 | $337,500 | $610,400 |
| 2018 | $20,067 | $947,900 | $337,500 | $610,400 |
| 2017 | $19,603 | $947,900 | $337,500 | $610,400 |
| 2016 | $19,574 | $947,900 | $337,500 | $610,400 |
| 2015 | $19,214 | $947,900 | $337,500 | $610,400 |
| 2014 | $18,778 | $947,900 | $337,500 | $610,400 |
Source: Public Records
Map
Nearby Homes