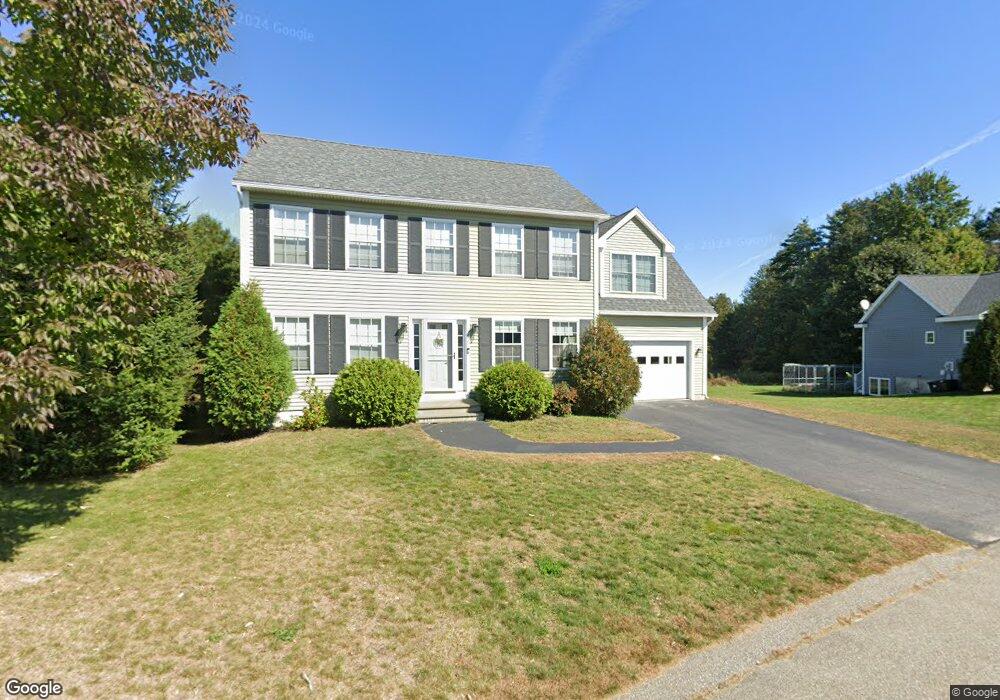
57 Wagner Farm Rd Gorham, ME 04038
Estimated Value: $669,000 - $756,000
3
Beds
3
Baths
1,664
Sq Ft
$424/Sq Ft
Est. Value
About This Home
This home is located at 57 Wagner Farm Rd, Gorham, ME 04038 and is currently estimated at $705,370, approximately $423 per square foot. 57 Wagner Farm Rd is a home located in Cumberland County with nearby schools including Narragansett Elementary School, Gorham Middle School, and Gorham High School.
Ownership History
Date
Name
Owned For
Owner Type
Purchase Details
Closed on
Sep 18, 2012
Sold by
D A Brackett & Co Inc
Bought by
Capozza 3Rd Joseph A and Capozza Billie M
Current Estimated Value
Home Financials for this Owner
Home Financials are based on the most recent Mortgage that was taken out on this home.
Original Mortgage
$225,000
Outstanding Balance
$152,894
Interest Rate
3.57%
Mortgage Type
New Conventional
Estimated Equity
$552,476
Purchase Details
Closed on
Sep 13, 2012
Sold by
Kelly Peter W and Kelly John P
Bought by
Risbara Bros Const Co Inc
Home Financials for this Owner
Home Financials are based on the most recent Mortgage that was taken out on this home.
Original Mortgage
$225,000
Outstanding Balance
$152,894
Interest Rate
3.57%
Mortgage Type
New Conventional
Estimated Equity
$552,476
Purchase Details
Closed on
Jul 30, 2009
Sold by
Risbara Bros Constr Co
Bought by
Kelly Peter W and Kelly John P
Create a Home Valuation Report for This Property
The Home Valuation Report is an in-depth analysis detailing your home's value as well as a comparison with similar homes in the area
Home Values in the Area
Average Home Value in this Area
Purchase History
| Date | Buyer | Sale Price | Title Company |
|---|---|---|---|
| Capozza 3Rd Joseph A | -- | -- | |
| Risbara Bros Const Co Inc | -- | -- | |
| Kelly Peter W | -- | -- |
Source: Public Records
Mortgage History
| Date | Status | Borrower | Loan Amount |
|---|---|---|---|
| Open | Capozza 3Rd Joseph A | $225,000 |
Source: Public Records
Tax History
| Year | Tax Paid | Tax Assessment Tax Assessment Total Assessment is a certain percentage of the fair market value that is determined by local assessors to be the total taxable value of land and additions on the property. | Land | Improvement |
|---|---|---|---|---|
| 2025 | $8,233 | $556,300 | $121,600 | $434,700 |
| 2024 | $8,178 | $556,300 | $121,600 | $434,700 |
| 2023 | $7,649 | $556,300 | $121,600 | $434,700 |
| 2022 | $7,148 | $556,300 | $121,600 | $434,700 |
| 2021 | $5,614 | $289,400 | $89,700 | $199,700 |
| 2020 | $5,499 | $289,400 | $89,700 | $199,700 |
| 2019 | $5,484 | $289,400 | $89,700 | $199,700 |
| 2018 | $4,910 | $289,400 | $89,700 | $199,700 |
| 2017 | $4,949 | $289,400 | $89,700 | $199,700 |
| 2016 | $4,682 | $275,400 | $89,700 | $185,700 |
| 2015 | $4,049 | $248,400 | $89,700 | $158,700 |
| 2014 | $3,614 | $207,700 | $68,300 | $139,400 |
| 2013 | $3,593 | $207,700 | $68,300 | $139,400 |
Source: Public Records
Map
Nearby Homes
- 4 Geranium Dr
- 0 Cobb Rd
- 25 Patio Park Ln
- 14 Patio Park Ln
- 52 Hogan Cir Unit 1
- 195 Falcon Crest Dr Unit 34
- 194 Falcon Crest Dr Unit 60
- 193 Falcon Crest Dr Unit 33
- 192 Falcon Crest Dr Unit 59
- 191 Falcon Crest Dr Unit 32
- 188 Falcon Crest Dr Unit 58
- 189 Falcon Crest Dr Unit 31
- 187 Falcon Crest Dr Unit 30
- 182 Falcon Crest Dr Unit 56
- 0 Libby Ave
- TBD Lochwood Dr
- 17 Lochwood Dr
- 49 Lochwood Dr
- 127 Falcon Crest Dr Unit 4
- 13 Lochwood Dr
- 59 Wagner Farm Rd
- 53 Wagner Farm Rd
- 58 Wagner Farm Rd
- 63 Wagner Farm Rd
- 63 Wagner Farm Road (Aka Lot 19)
- 51 (Lot 15) Wagner Farm Rd
- 52 Wagner Farm Rd
- 68 Wagner Farm Rd
- 50 Wagner Farm Rd
- 47 Wagner Farm Rd
- 51 Wagner Farm Rd
- 76 Wagner Farm Rd
- 26 Timber Ridge Rd
- 46 Wagner Farm Rd
- 80 Wagner Farm Rd
- 222 Libby Ave
- 240 Libby Ave
- 41 Wagner Farm Rd
- 82 Wagner Farm Rd
- 42 Wagner Farm Rd
Your Personal Tour Guide
Ask me questions while you tour the home.