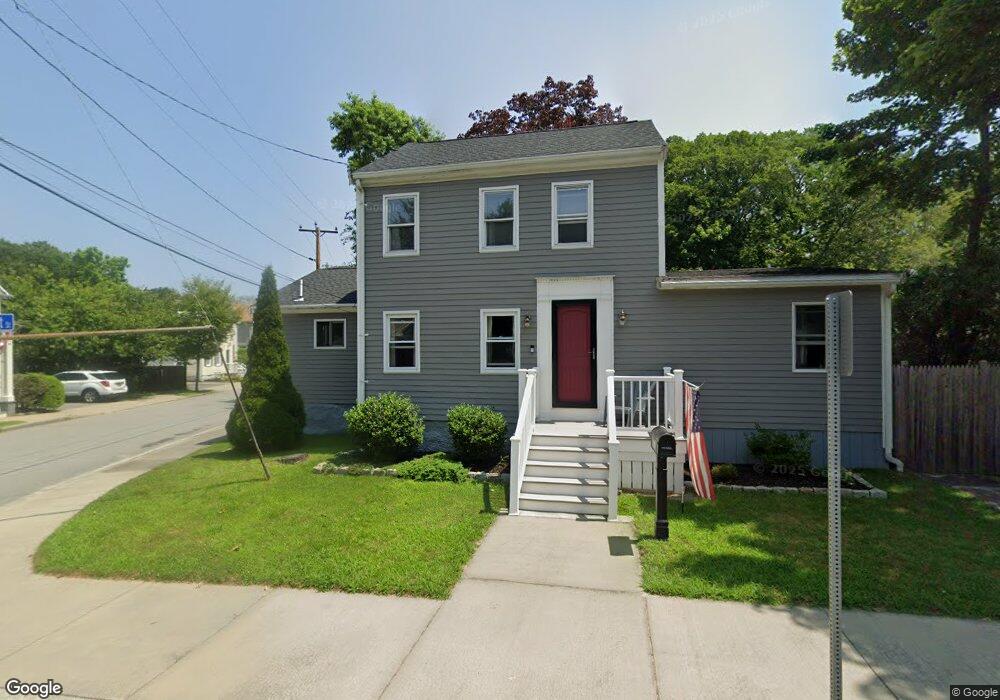
57 Walnut St Fairhaven, MA 02719
Estimated Value: $431,000 - $525,000
3
Beds
2
Baths
1,306
Sq Ft
$373/Sq Ft
Est. Value
About This Home
This home is located at 57 Walnut St, Fairhaven, MA 02719 and is currently estimated at $486,490, approximately $372 per square foot. 57 Walnut St is a home located in Bristol County with nearby schools including Fairhaven High School, City On A Hill Charter Public School New Bedford, and St. Joseph School.
Ownership History
Date
Name
Owned For
Owner Type
Purchase Details
Closed on
Oct 4, 2023
Sold by
Travers Richard J
Bought by
Travers Richard J and Travers Wendy A
Current Estimated Value
Purchase Details
Closed on
Apr 18, 1989
Sold by
Price Eileen T
Bought by
Minihan Cornelius J
Home Financials for this Owner
Home Financials are based on the most recent Mortgage that was taken out on this home.
Original Mortgage
$37,500
Interest Rate
10.85%
Mortgage Type
Purchase Money Mortgage
Create a Home Valuation Report for This Property
The Home Valuation Report is an in-depth analysis detailing your home's value as well as a comparison with similar homes in the area
Home Values in the Area
Average Home Value in this Area
Purchase History
| Date | Buyer | Sale Price | Title Company |
|---|---|---|---|
| Travers Richard J | -- | None Available | |
| Minihan Cornelius J | $50,000 | -- | |
| Minihan Cornelius J | $50,000 | -- |
Source: Public Records
Mortgage History
| Date | Status | Borrower | Loan Amount |
|---|---|---|---|
| Previous Owner | Minihan Cornelius J | $126,100 | |
| Previous Owner | Minihan Cornelius J | $155,000 | |
| Previous Owner | Minihan Cornelius J | $39,500 | |
| Previous Owner | Minihan Cornelius J | $37,500 |
Source: Public Records
Tax History
| Year | Tax Paid | Tax Assessment Tax Assessment Total Assessment is a certain percentage of the fair market value that is determined by local assessors to be the total taxable value of land and additions on the property. | Land | Improvement |
|---|---|---|---|---|
| 2025 | $34 | $366,400 | $181,300 | $185,100 |
| 2024 | $3,298 | $357,300 | $181,300 | $176,000 |
| 2023 | $3,297 | $331,400 | $168,100 | $163,300 |
| 2022 | $3,233 | $316,300 | $160,100 | $156,200 |
| 2021 | $4,238 | $272,200 | $145,600 | $126,600 |
| 2020 | $7,012 | $265,600 | $139,000 | $126,600 |
| 2019 | $2,839 | $243,300 | $126,500 | $116,800 |
| 2018 | $2,726 | $230,300 | $120,400 | $109,900 |
| 2017 | $2,678 | $222,400 | $120,400 | $102,000 |
| 2016 | $2,604 | $213,800 | $120,400 | $93,400 |
| 2015 | $2,571 | $211,600 | $120,400 | $91,200 |
Source: Public Records
Map
Nearby Homes
Your Personal Tour Guide
Ask me questions while you tour the home.