Estimated Value: $709,272 - $844,000
3
Beds
2
Baths
1,500
Sq Ft
$509/Sq Ft
Est. Value
About This Home
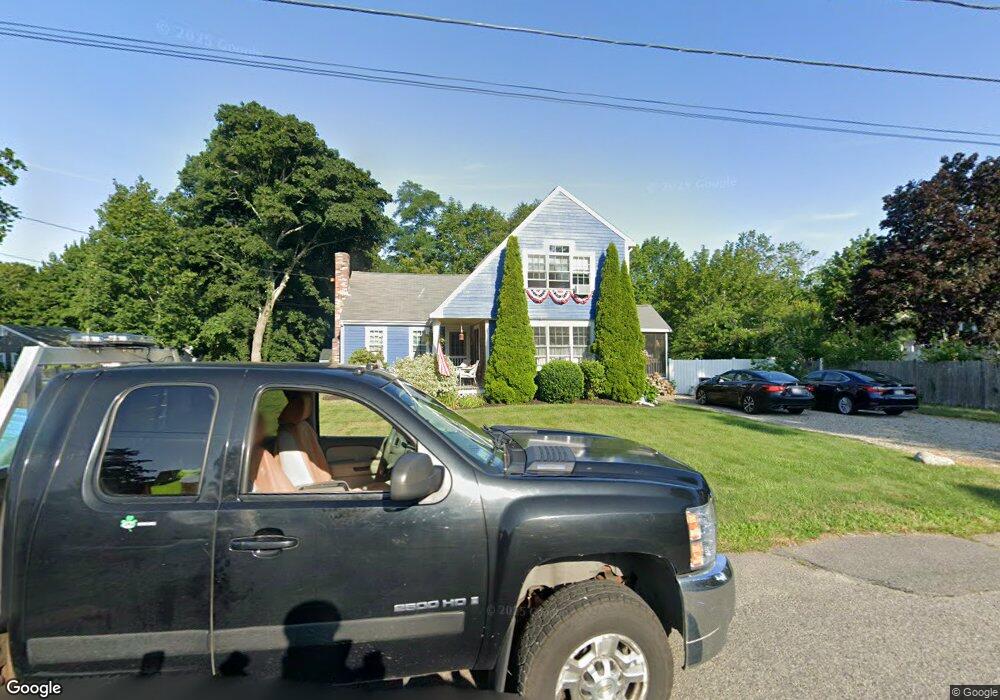
This home is located at 57 West St, Marshfield, MA 02050 and is currently estimated at $763,318, approximately $508 per square foot. 57 West St is a home located in Plymouth County with nearby schools including Governor Edward Winslow School, Furnace Brook Middle School, and Marshfield High School.
Ownership History
Date
Name
Owned For
Owner Type
Purchase Details
Closed on
Aug 22, 2014
Sold by
Gilligan Steven G
Bought by
Gilligan Margaret A
Current Estimated Value
Purchase Details
Closed on
Sep 13, 1993
Sold by
Mccabe Joseph E and Mccabe Colleen C
Bought by
Gilligan Steven G and Gilligan Margaret A
Purchase Details
Closed on
Dec 15, 1989
Sold by
Kinniburgh Grace M
Bought by
Mccabe Joseph E
Purchase Details
Closed on
Oct 14, 1987
Sold by
Martina Peter
Bought by
Kinniburgh James E
Create a Home Valuation Report for This Property
The Home Valuation Report is an in-depth analysis detailing your home's value as well as a comparison with similar homes in the area
Home Values in the Area
Average Home Value in this Area
Purchase History
| Date | Buyer | Sale Price | Title Company |
|---|---|---|---|
| Gilligan Margaret A | -- | -- | |
| Gilligan Margaret A | -- | -- | |
| Gilligan Steven G | $124,000 | -- | |
| Mccabe Joseph E | $143,000 | -- | |
| Kinniburgh James E | $153,000 | -- |
Source: Public Records
Mortgage History
| Date | Status | Borrower | Loan Amount |
|---|---|---|---|
| Previous Owner | Kinniburgh James E | $270,000 | |
| Previous Owner | Kinniburgh James E | $239,000 |
Source: Public Records
Tax History Compared to Growth
Tax History
| Year | Tax Paid | Tax Assessment Tax Assessment Total Assessment is a certain percentage of the fair market value that is determined by local assessors to be the total taxable value of land and additions on the property. | Land | Improvement |
|---|---|---|---|---|
| 2025 | $6,404 | $646,900 | $322,800 | $324,100 |
| 2024 | $6,120 | $589,000 | $302,600 | $286,400 |
| 2023 | $5,993 | $529,400 | $272,400 | $257,000 |
| 2022 | $5,593 | $431,900 | $232,000 | $199,900 |
| 2021 | $5,375 | $407,500 | $221,900 | $185,600 |
| 2020 | $4,911 | $368,400 | $191,700 | $176,700 |
| 2019 | $4,929 | $368,400 | $191,700 | $176,700 |
| 2018 | $4,926 | $368,400 | $191,700 | $176,700 |
| 2017 | $4,558 | $332,200 | $181,600 | $150,600 |
| 2016 | $4,319 | $311,200 | $171,500 | $139,700 |
| 2015 | $4,136 | $311,200 | $171,500 | $139,700 |
| 2014 | $3,898 | $293,300 | $171,500 | $121,800 |
Source: Public Records
Map
Nearby Homes
- 106 Careswell St
- 57 Island St
- 78 Tower Ave
- 256 Ocean St
- 335 Ocean St
- 328 Ocean St
- 71 Gurnet Rd
- 5 Adelaide Way
- 24 Second (2nd) Rd
- 19 2nd Rd
- 90 Presidential Cir
- 32 Gratto Rd
- 11 Leon St
- 30 Chandler Dr
- 74 Abrams Hill Rd
- 68 Abrams Hill Rd
- 713 Webster St
- 39 Bay Pond Rd
- 236 Powder Point Ave
- 387 Lot 2A Old Cove Rd