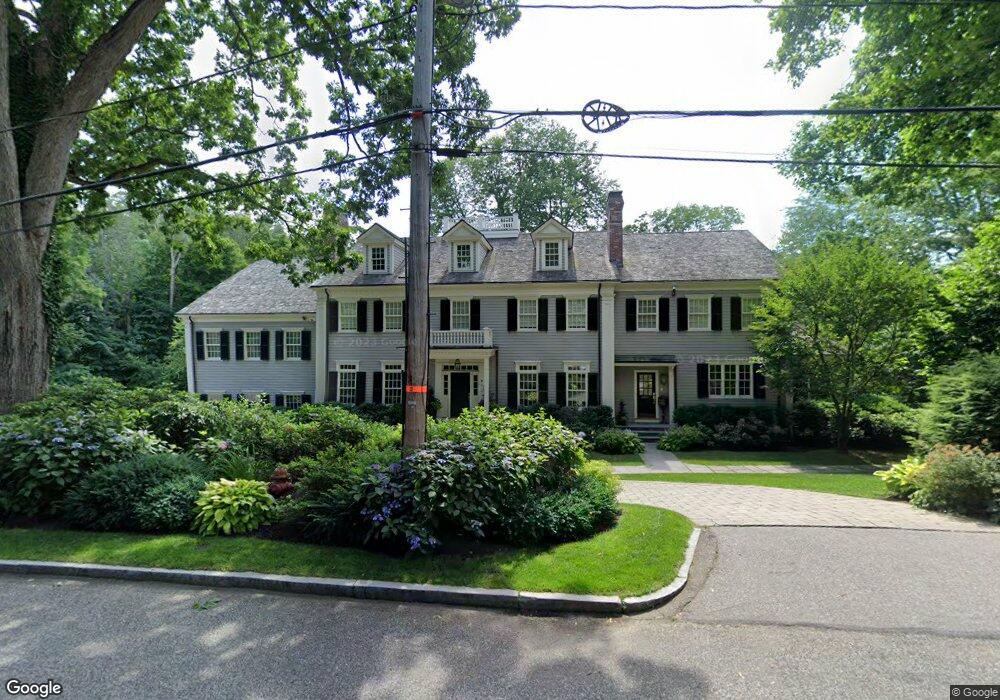
57 Whiting Rd Wellesley Hills, MA 02481
Estimated Value: $5,082,536 - $6,534,000
5
Beds
6
Baths
6,500
Sq Ft
$908/Sq Ft
Est. Value
About This Home
This home is located at 57 Whiting Rd, Wellesley Hills, MA 02481 and is currently estimated at $5,900,179, approximately $907 per square foot. 57 Whiting Rd is a home located in Norfolk County with nearby schools including Joseph E. Fiske Elementary School, Wellesley Middle School, and Wellesley Sr High School.
Ownership History
Date
Name
Owned For
Owner Type
Purchase Details
Closed on
Nov 6, 2008
Sold by
Dyer Joseph P and Dyer Rose M
Bought by
Levin Martin
Current Estimated Value
Purchase Details
Closed on
Jan 4, 2005
Sold by
57 Whiting T
Bought by
Levin Martin H and Levin Terri
Purchase Details
Closed on
Sep 17, 2003
Sold by
57 Whiting Road Rt and Kerr Nadine P
Bought by
57 Whiting T and Bevilacqua Paul
Create a Home Valuation Report for This Property
The Home Valuation Report is an in-depth analysis detailing your home's value as well as a comparison with similar homes in the area
Purchase History
| Date | Buyer | Sale Price | Title Company |
|---|---|---|---|
| Levin Martin | $1,100,000 | -- | |
| Levin Martin H | $3,275,000 | -- | |
| 57 Whiting T | $1,000,000 | -- |
Source: Public Records
Tax History
| Year | Tax Paid | Tax Assessment Tax Assessment Total Assessment is a certain percentage of the fair market value that is determined by local assessors to be the total taxable value of land and additions on the property. | Land | Improvement |
|---|---|---|---|---|
| 2025 | $49,036 | $4,770,000 | $1,838,000 | $2,932,000 |
| 2024 | $48,802 | $4,688,000 | $1,838,000 | $2,850,000 |
| 2023 | $50,071 | $4,373,000 | $1,640,000 | $2,733,000 |
| 2022 | $49,079 | $4,202,000 | $1,470,000 | $2,732,000 |
| 2021 | $48,175 | $4,100,000 | $1,368,000 | $2,732,000 |
| 2020 | $47,396 | $4,100,000 | $1,368,000 | $2,732,000 |
| 2019 | $48,027 | $4,151,000 | $1,419,000 | $2,732,000 |
| 2018 | $44,442 | $3,719,000 | $929,000 | $2,790,000 |
| 2017 | $43,847 | $3,719,000 | $929,000 | $2,790,000 |
| 2016 | $47,308 | $3,999,000 | $913,000 | $3,086,000 |
| 2015 | $46,194 | $3,996,000 | $913,000 | $3,083,000 |
Source: Public Records
Map
Nearby Homes
- 15 Alden Rd
- 15 Great Plain Ave
- 28 Rice St
- 29 Abbott Rd
- 29 Rockland St
- 15 Clifton Rd
- 40 Kimlo Rd
- 560 Worcester St
- 18 Eaton Ct
- 7 Cliff Rd
- 151 Oakland St
- 1 Clock Tower Dr
- 42 Edmunds Rd
- 6 Oakland Cir
- 44 Bradford Rd
- 81 Audubon Rd
- 85 Grove St Unit 311
- 85 Grove St Unit 306
- 85 Grove St Unit 203
- 100 Linden St Unit 111
Your Personal Tour Guide
Ask me questions while you tour the home.