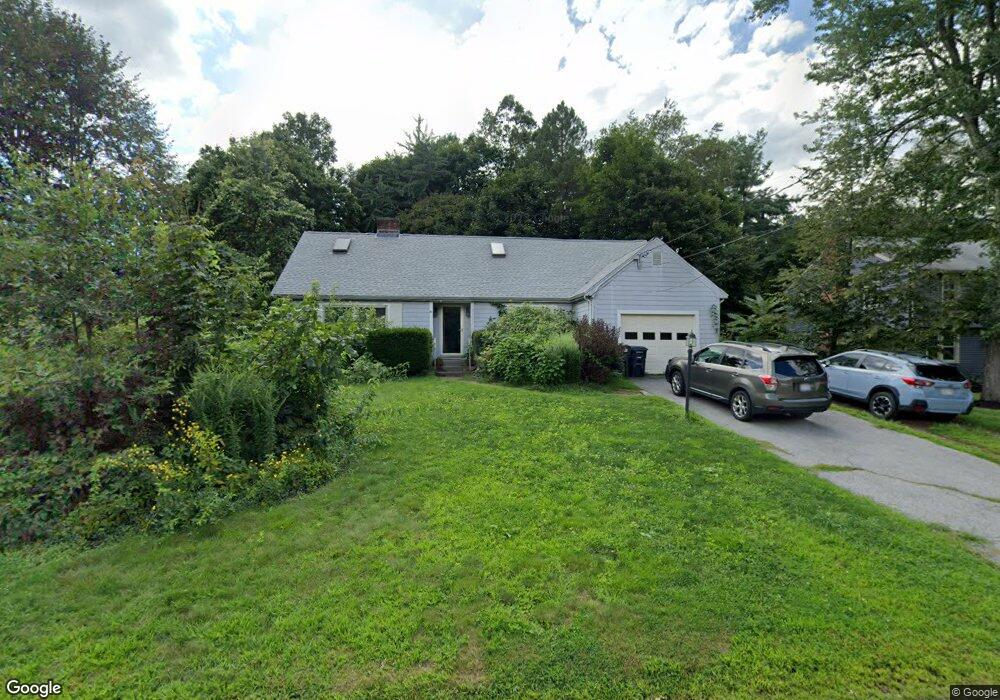
57 Winfield Rd Holden, MA 01520
Estimated Value: $533,000 - $625,000
4
Beds
3
Baths
1,786
Sq Ft
$323/Sq Ft
Est. Value
About This Home
This home is located at 57 Winfield Rd, Holden, MA 01520 and is currently estimated at $577,698, approximately $323 per square foot. 57 Winfield Rd is a home located in Worcester County with nearby schools including Wachusett Regional High School, Abby Kelley Foster Charter Public School, and Bancroft School.
Create a Home Valuation Report for This Property
The Home Valuation Report is an in-depth analysis detailing your home's value as well as a comparison with similar homes in the area
Home Values in the Area
Average Home Value in this Area
Tax History Compared to Growth
Tax History
| Year | Tax Paid | Tax Assessment Tax Assessment Total Assessment is a certain percentage of the fair market value that is determined by local assessors to be the total taxable value of land and additions on the property. | Land | Improvement |
|---|---|---|---|---|
| 2025 | $6,254 | $451,200 | $172,600 | $278,600 |
| 2024 | $6,012 | $424,900 | $167,500 | $257,400 |
| 2023 | $5,660 | $377,600 | $145,600 | $232,000 |
| 2022 | $5,407 | $326,500 | $113,800 | $212,700 |
| 2021 | $5,251 | $301,800 | $108,300 | $193,500 |
| 2020 | $5,017 | $295,100 | $103,200 | $191,900 |
| 2019 | $4,842 | $277,500 | $103,200 | $174,300 |
| 2018 | $5,003 | $284,100 | $98,300 | $185,800 |
| 2017 | $4,653 | $264,500 | $98,300 | $166,200 |
| 2016 | $4,359 | $252,700 | $93,600 | $159,100 |
| 2015 | $4,450 | $245,600 | $93,600 | $152,000 |
| 2014 | $4,359 | $245,600 | $93,600 | $152,000 |
Source: Public Records
Map
Nearby Homes
- 83 Stoneleigh Rd
- 93 Winfield Rd
- 21 Wyoming Dr
- 15 Lowell Ave
- 29 Glenwood St
- 22 Danielles Way
- 26 Danielles Way
- 31 Danielles Way
- 250 Shrewsbury St
- 9 Birchwood Dr
- 9 Idalla Ave
- 39 Meola Ave
- 33 Meola Ave
- 47 Preservation Ln
- 15 Cumberland St
- 29 Isleboro St
- 33 Isleboro St
- 160 Shrewsbury St
- 12 Dixfield Rd
- 1097 W Boylston St
- 49 Winfield Rd
- 63 Winfield Rd
- 102 Stoneleigh Rd
- 102 Stoneleigh Rd Unit 1
- 94 Stoneleigh Rd
- 71 Winfield Rd
- 58 Winfield Rd
- 50 Winfield Rd
- 86 Stoneleigh Rd
- 108 Stoneleigh Rd
- 64 Winfield Rd
- 39 Winfield Rd
- 80 Stoneleigh Rd
- 101 Stoneleigh Rd
- 76 Winfield Rd
- 75 Winfield Rd
- 95 Stoneleigh Rd
- 114 Stoneleigh Rd
- 89 Stoneleigh Rd
- 49 Woodridge Rd