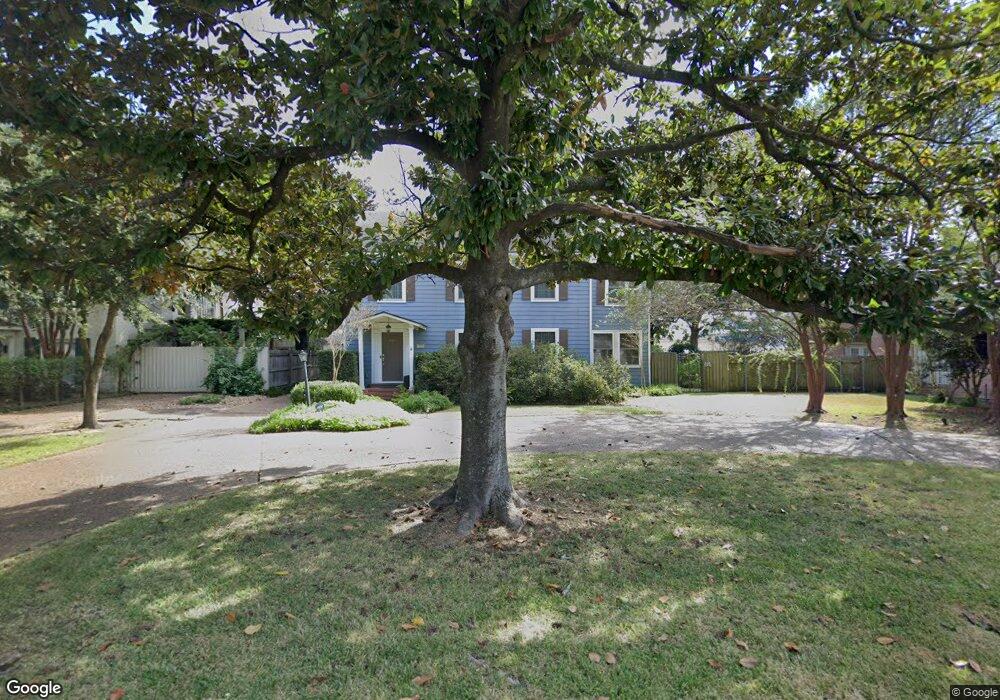
570 19th St Beaumont, TX 77706
West End NeighborhoodEstimated Value: $247,198 - $366,000
--
Bed
--
Bath
2,464
Sq Ft
$123/Sq Ft
Est. Value
About This Home
This home is located at 570 19th St, Beaumont, TX 77706 and is currently estimated at $302,550, approximately $122 per square foot. 570 19th St is a home located in Jefferson County with nearby schools including Regina Howell Elementary School, Marshall Middle School, and West Brook Sr High School.
Ownership History
Date
Name
Owned For
Owner Type
Purchase Details
Closed on
Aug 12, 2008
Sold by
Dinkle Roy Matthewson and Dinkle Patricia
Bought by
Shelton Jeremy A and Shelton Katrina C
Current Estimated Value
Home Financials for this Owner
Home Financials are based on the most recent Mortgage that was taken out on this home.
Original Mortgage
$112,000
Outstanding Balance
$73,382
Interest Rate
6.38%
Mortgage Type
Purchase Money Mortgage
Estimated Equity
$229,168
Purchase Details
Closed on
Nov 26, 2003
Sold by
Cendant Mobility Financial Corp
Bought by
Dinkle Roy Matthewson and Dinkle Patricia
Home Financials for this Owner
Home Financials are based on the most recent Mortgage that was taken out on this home.
Original Mortgage
$169,100
Interest Rate
5.94%
Mortgage Type
Purchase Money Mortgage
Create a Home Valuation Report for This Property
The Home Valuation Report is an in-depth analysis detailing your home's value as well as a comparison with similar homes in the area
Home Values in the Area
Average Home Value in this Area
Purchase History
| Date | Buyer | Sale Price | Title Company |
|---|---|---|---|
| Shelton Jeremy A | -- | None Available | |
| Dinkle Roy Matthewson | -- | Jefferson County Title Co |
Source: Public Records
Mortgage History
| Date | Status | Borrower | Loan Amount |
|---|---|---|---|
| Open | Shelton Jeremy A | $112,000 | |
| Previous Owner | Dinkle Roy Matthewson | $169,100 |
Source: Public Records
Tax History Compared to Growth
Tax History
| Year | Tax Paid | Tax Assessment Tax Assessment Total Assessment is a certain percentage of the fair market value that is determined by local assessors to be the total taxable value of land and additions on the property. | Land | Improvement |
|---|---|---|---|---|
| 2025 | $4,691 | $275,938 | $31,500 | $244,438 |
| 2024 | $4,691 | $259,080 | $31,500 | $227,580 |
| 2023 | $4,691 | $259,080 | $31,500 | $227,580 |
| 2022 | $6,330 | $242,223 | $31,500 | $210,723 |
| 2021 | $6,119 | $225,365 | $31,500 | $193,865 |
| 2020 | $5,091 | $210,942 | $31,500 | $179,442 |
| 2019 | $5,899 | $210,970 | $31,500 | $179,470 |
| 2018 | $5,073 | $204,560 | $31,500 | $173,060 |
| 2017 | $4,993 | $204,560 | $31,500 | $173,060 |
| 2016 | $5,624 | $204,560 | $31,500 | $173,060 |
| 2015 | $4,782 | $191,740 | $31,500 | $160,240 |
| 2014 | $4,782 | $191,740 | $31,500 | $160,240 |
Source: Public Records
Map
Nearby Homes