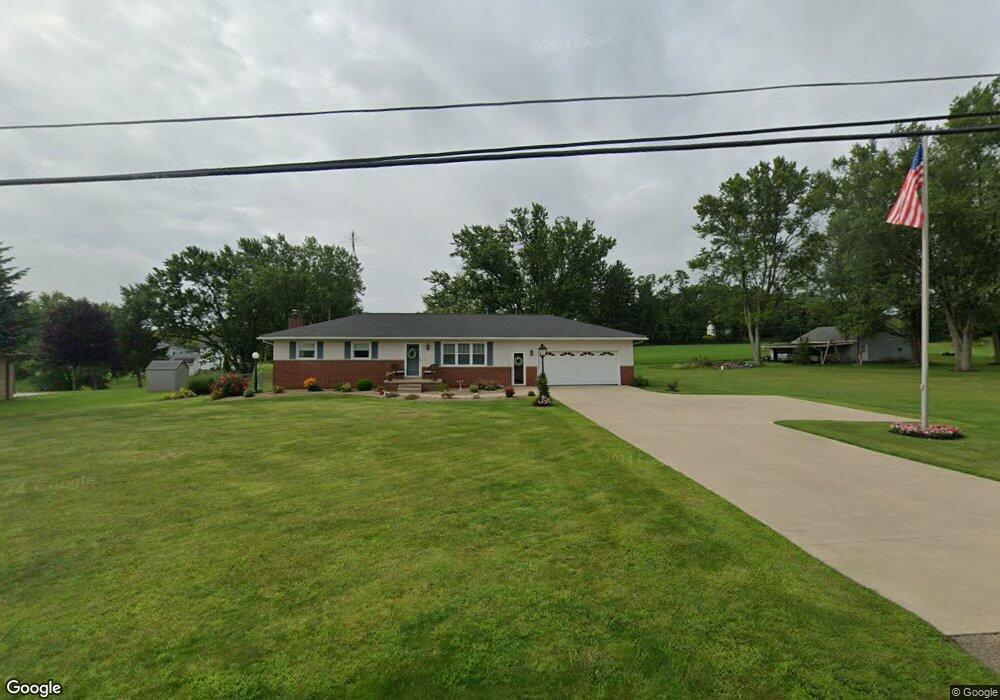
570 53rd St SW Canton, OH 44706
Estimated Value: $151,000 - $251,000
3
Beds
2
Baths
1,232
Sq Ft
$167/Sq Ft
Est. Value
About This Home
This home is located at 570 53rd St SW, Canton, OH 44706 and is currently estimated at $205,251, approximately $166 per square foot. 570 53rd St SW is a home located in Stark County with nearby schools including Faircrest Memorial Elementary School, Canton South High School, and Beacon Academy.
Ownership History
Date
Name
Owned For
Owner Type
Purchase Details
Closed on
Mar 1, 2002
Sold by
Nolan Thomas L
Bought by
Nolan Thomas L and Nolan Karen Sue
Current Estimated Value
Purchase Details
Closed on
May 24, 2001
Sold by
Nolan Irene I
Bought by
Nolan Thomas L
Purchase Details
Closed on
Feb 27, 1995
Sold by
Irwin Dorothy M
Bought by
Nolan Thomas L and Nolan Irene L
Create a Home Valuation Report for This Property
The Home Valuation Report is an in-depth analysis detailing your home's value as well as a comparison with similar homes in the area
Purchase History
| Date | Buyer | Sale Price | Title Company |
|---|---|---|---|
| Nolan Thomas L | -- | -- | |
| Nolan Thomas L | -- | -- | |
| Nolan Thomas L | $80,000 | -- |
Source: Public Records
Tax History
| Year | Tax Paid | Tax Assessment Tax Assessment Total Assessment is a certain percentage of the fair market value that is determined by local assessors to be the total taxable value of land and additions on the property. | Land | Improvement |
|---|---|---|---|---|
| 2025 | -- | $57,090 | $5,390 | $51,700 |
| 2024 | -- | $57,090 | $5,390 | $51,700 |
| 2023 | $1,733 | $46,410 | $5,250 | $41,160 |
| 2022 | $811 | $46,410 | $5,250 | $41,160 |
| 2021 | $1,626 | $46,410 | $5,250 | $41,160 |
| 2020 | $1,485 | $38,720 | $4,450 | $34,270 |
| 2019 | $1,509 | $38,720 | $4,450 | $34,270 |
Source: Public Records
Map
Nearby Homes
- 600 53rd St SW
- 5247 Birchmont Ave SW
- 0 Birchmont Ave SW Unit 5185117
- 4847 Ashmont Ave SW
- 0 49th St SW Unit 5185153
- 0 49th St SW Unit 5185124
- 5213 Ridge Ave SE
- 327 39th St SW
- 1005 Overlook Dr SW
- 3673 Highview Ave SW
- 0 Rexdale St SW
- 330 34th St SW
- 2749 Deer Pass Dr SW
- 337 33rd St SW
- 260 Ironwood St SW
- VL 38th St SW
- 3863 Richville Dr SW
- 4119 Paradise St SW
- 3363 Shepler Church Ave SW
- 2103 Henry Ave SW
- 556 53rd St SW
- 569 Fohl St SW
- 577 53rd St SW
- 555 53rd St SW
- 547 Fohl St SW
- 524 53rd St SW
- 576 Fohl St SW
- 523 Fohl St SW
- 510 53rd St SW
- 538 Fohl St SW
- 560 Fohl St SW
- 546 Fohl St SW
- 505 Fohl St SW
- 511 53rd St SW
- 5214 Ashmont Ave SW
- 5227 Ashmont Ave SW
- 524 Fohl St SW
- 530 Fohl St SW
- 512 Fohl St SW
- 418 53rd St SW
Your Personal Tour Guide
Ask me questions while you tour the home.