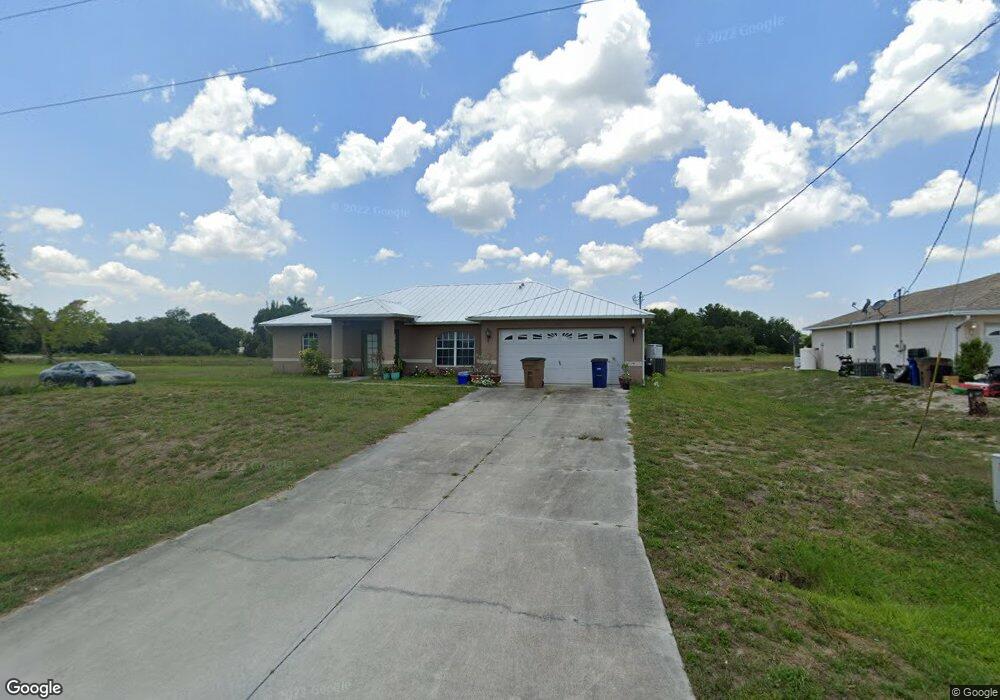
570 Pachman Cir Unit 16 Lehigh Acres, FL 33974
Alabama NeighborhoodEstimated Value: $293,000 - $374,000
3
Beds
2
Baths
1,937
Sq Ft
$170/Sq Ft
Est. Value
About This Home
This home is located at 570 Pachman Cir Unit 16, Lehigh Acres, FL 33974 and is currently estimated at $329,912, approximately $170 per square foot. 570 Pachman Cir Unit 16 is a home located in Lee County with nearby schools including Lehigh Elementary School, Gateway Elementary School, and The Alva School.
Ownership History
Date
Name
Owned For
Owner Type
Purchase Details
Closed on
Oct 26, 2017
Sold by
Mcneely James and Mcneely Melinda
Bought by
Tammvongsn David
Current Estimated Value
Purchase Details
Closed on
Jan 12, 2011
Sold by
Fannie Mae
Bought by
Thammavongsa David
Home Financials for this Owner
Home Financials are based on the most recent Mortgage that was taken out on this home.
Original Mortgage
$77,972
Interest Rate
4.58%
Mortgage Type
FHA
Purchase Details
Closed on
Oct 8, 2010
Sold by
Mcneeley Michael James
Bought by
Federal National Mortgage Association
Purchase Details
Closed on
Mar 29, 2002
Sold by
1St Home Bldr Fl
Bought by
Mcneeley Michael James and Mcneeley Kimberly
Home Financials for this Owner
Home Financials are based on the most recent Mortgage that was taken out on this home.
Original Mortgage
$96,100
Interest Rate
6.89%
Mortgage Type
Purchase Money Mortgage
Create a Home Valuation Report for This Property
The Home Valuation Report is an in-depth analysis detailing your home's value as well as a comparison with similar homes in the area
Home Values in the Area
Average Home Value in this Area
Purchase History
| Date | Buyer | Sale Price | Title Company |
|---|---|---|---|
| Tammvongsn David | $7,500 | Liberty Title & Escrow Co | |
| Thammavongsa David | $80,000 | Title & Abstract Agency Of A | |
| Federal National Mortgage Association | -- | None Available | |
| Mcneeley Michael James | $5,900 | -- |
Source: Public Records
Mortgage History
| Date | Status | Borrower | Loan Amount |
|---|---|---|---|
| Previous Owner | Thammavongsa David | $77,972 | |
| Previous Owner | Mcneeley Michael James | $96,100 |
Source: Public Records
Tax History Compared to Growth
Tax History
| Year | Tax Paid | Tax Assessment Tax Assessment Total Assessment is a certain percentage of the fair market value that is determined by local assessors to be the total taxable value of land and additions on the property. | Land | Improvement |
|---|---|---|---|---|
| 2025 | $3,413 | $235,054 | $17,765 | $217,289 |
| 2024 | $2,885 | $189,266 | -- | -- |
| 2023 | $3,296 | $172,060 | $0 | $0 |
| 2022 | $2,885 | $156,418 | $0 | $0 |
| 2021 | $2,480 | $161,537 | $6,500 | $155,037 |
| 2020 | $2,372 | $151,809 | $5,500 | $146,309 |
| 2019 | $2,260 | $137,269 | $4,500 | $132,769 |
| 2018 | $2,182 | $134,843 | $4,255 | $130,588 |
| 2017 | $2,088 | $129,201 | $4,325 | $124,876 |
| 2016 | $1,833 | $99,895 | $4,325 | $95,570 |
| 2015 | $1,719 | $91,496 | $3,760 | $87,736 |
| 2014 | -- | $84,401 | $2,350 | $82,051 |
| 2013 | -- | $70,404 | $2,800 | $67,604 |
Source: Public Records
Map
Nearby Homes
- 110 Talisman St
- 575 Bourse Cir Unit 18
- 102 Parish Dr
- 569 Bourse Cir
- 106 Parish Dr
- 2502 55th St SW
- 131 Grant Blvd
- 631 Tarapin Ave
- 118 Parish Dr
- 634 Tarapin Ave Unit 1
- 635 Tomasello Dr
- 2512 52nd St SW
- 2517 54th St SW
- 2508 51st St W
- 2514 52nd St SW
- 509 Pennfield Ave Unit 1
- 2512 51st St SW
- 607 Pelee Ave
- 506 Palencia Ct
- 2601 51st St SW
- 568 Pachman Cir
- 572 Pachman Cir
- 566 Pachman Cir
- 569 Pachman Cir
- 574 Pachman Cir
- 573 Pachman Cir
- 567 Pachman Cir
- 111 Talisman St
- 575 Pachman Cir
- 564 Pachman Cir
- 112 Talisman St
- 576 Pachman Cir
- 110 Pako Place
- 565 Pachman Cir
- 147 Grant Blvd
- 151 Grant Blvd
- 563 Pachman Cir
- 577 Pachman Cir Unit 1
- 562 Pachman Cir
- 145 Grant Blvd