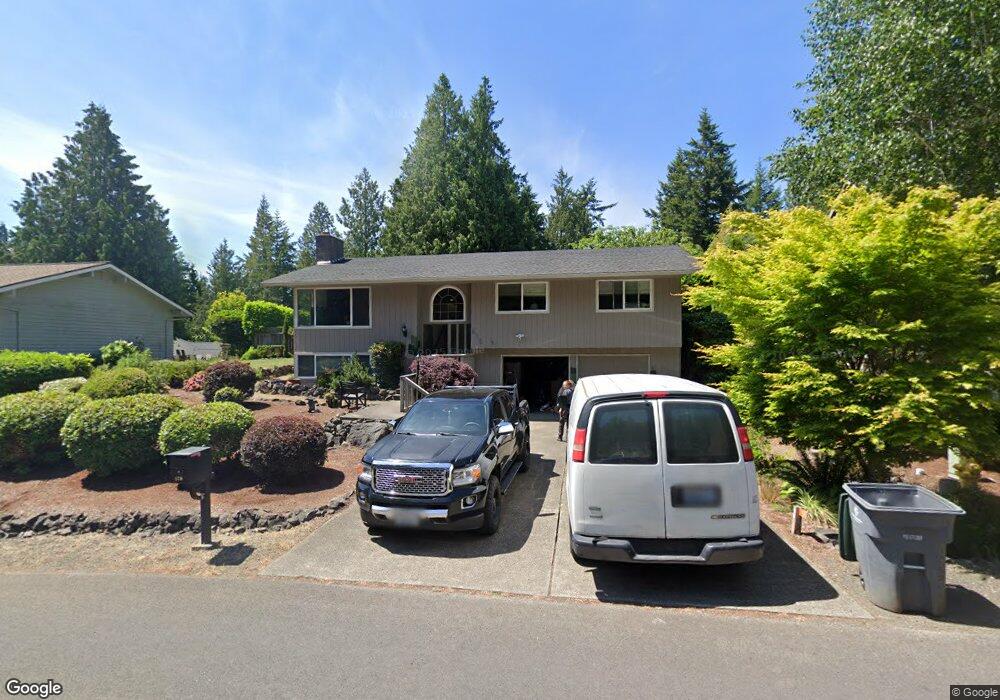
570 Rainier Ln Port Ludlow, WA 98365
Port Ludlow NeighborhoodEstimated Value: $460,000 - $541,000
3
Beds
3
Baths
1,445
Sq Ft
$344/Sq Ft
Est. Value
About This Home
This home is located at 570 Rainier Ln, Port Ludlow, WA 98365 and is currently estimated at $497,760, approximately $344 per square foot. 570 Rainier Ln is a home located in Jefferson County with nearby schools including Chimacum Creek Primary School, Chimacum School Pi Program, and Chimacum Elementary School.
Ownership History
Date
Name
Owned For
Owner Type
Purchase Details
Closed on
Jun 25, 2021
Sold by
Lawson Anne E
Bought by
Whinery Tommy and Whinery Lori
Current Estimated Value
Home Financials for this Owner
Home Financials are based on the most recent Mortgage that was taken out on this home.
Original Mortgage
$193,135
Outstanding Balance
$174,860
Interest Rate
2.9%
Mortgage Type
VA
Estimated Equity
$322,900
Purchase Details
Closed on
Mar 7, 2018
Sold by
Lawson William David
Bought by
Lawson Anne Elizabeth
Purchase Details
Closed on
Mar 1, 2005
Sold by
Lawson William David and Lawson Anne Elizabeth
Bought by
Lawon William David and Lawon Anne Elizabeth
Home Financials for this Owner
Home Financials are based on the most recent Mortgage that was taken out on this home.
Original Mortgage
$211,000
Interest Rate
5.61%
Mortgage Type
New Conventional
Create a Home Valuation Report for This Property
The Home Valuation Report is an in-depth analysis detailing your home's value as well as a comparison with similar homes in the area
Home Values in the Area
Average Home Value in this Area
Purchase History
| Date | Buyer | Sale Price | Title Company |
|---|---|---|---|
| Whinery Tommy | $205,000 | First American Title Ins Co | |
| Lawson Anne Elizabeth | -- | None Available | |
| Lawon William David | -- | None Available |
Source: Public Records
Mortgage History
| Date | Status | Borrower | Loan Amount |
|---|---|---|---|
| Open | Whinery Tommy | $193,135 | |
| Previous Owner | Lawon William David | $211,000 |
Source: Public Records
Tax History Compared to Growth
Tax History
| Year | Tax Paid | Tax Assessment Tax Assessment Total Assessment is a certain percentage of the fair market value that is determined by local assessors to be the total taxable value of land and additions on the property. | Land | Improvement |
|---|---|---|---|---|
| 2024 | $3,059 | $405,872 | $105,000 | $300,872 |
| 2023 | $3,059 | $383,336 | $95,000 | $288,336 |
| 2022 | $2,763 | $365,800 | $90,000 | $275,800 |
| 2021 | $2,692 | $299,144 | $71,500 | $227,644 |
| 2020 | $2,587 | $273,884 | $62,500 | $211,384 |
| 2019 | $2,358 | $252,624 | $57,500 | $195,124 |
| 2018 | $2,450 | $231,363 | $52,500 | $178,863 |
| 2017 | $2,330 | $212,603 | $50,000 | $162,603 |
| 2016 | $2,174 | $204,473 | $50,000 | $154,473 |
| 2015 | $2,173 | $188,552 | $86,250 | $102,302 |
| 2014 | -- | $188,552 | $86,250 | $102,302 |
| 2013 | -- | $163,960 | $75,000 | $88,960 |
Source: Public Records
Map
Nearby Homes
- 639 Rainier Ln
- 381 Rainier Ln
- 23 Machias Loop
- 61 Olympic Ln
- 103 Wells Ridge Ct
- 91 Drew Ln
- 181 N Bay Ln Unit 6
- 142 Resolute Ln
- 110 Cressey Ln
- 20 Bluebird Ln
- 21 Camano Ln
- 1 Pintail Rd
- 150 Ebb Tide Ct
- Ponderosa Plan at Olympic Terrace
- Daniel Plan at Olympic Terrace
- 31 McCartney Peak Ln Unit 76
- Decker Plan at Olympic Terrace
- 140 Condon Ln
- 140 Admiralty Ln Unit 370
- 91 N Chandler Ct Unit D