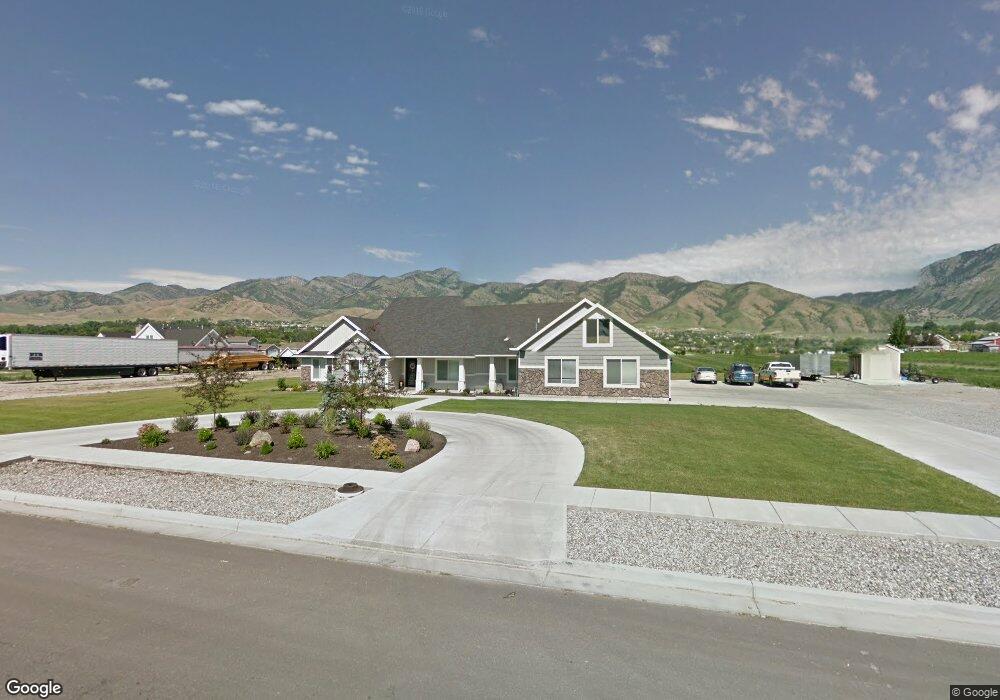
570 S 100 W Hyde Park, UT 84318
Estimated Value: $770,000 - $881,000
--
Bed
--
Bath
3,927
Sq Ft
$211/Sq Ft
Est. Value
About This Home
This home is located at 570 S 100 W, Hyde Park, UT 84318 and is currently estimated at $829,518, approximately $211 per square foot. 570 S 100 W is a home with nearby schools including North Park School, Cedar Ridge School, and Cedar Ridge Middle School.
Ownership History
Date
Name
Owned For
Owner Type
Purchase Details
Closed on
Apr 15, 2025
Sold by
Balls Kent Marsden and Balls Wendy Maughan
Bought by
Kent And Wendy Balls Trust and Balls
Current Estimated Value
Home Financials for this Owner
Home Financials are based on the most recent Mortgage that was taken out on this home.
Original Mortgage
$626,000
Outstanding Balance
$623,211
Interest Rate
6.63%
Mortgage Type
New Conventional
Estimated Equity
$206,307
Purchase Details
Closed on
Feb 3, 2023
Sold by
Balls Kent M and Balls Wendy M
Bought by
Kent And Wendy Balls Trust
Purchase Details
Closed on
Sep 27, 2022
Sold by
Balls Kent M and Balls Wendy M
Bought by
Kent And Wendy Balls Trust
Purchase Details
Closed on
Sep 18, 2019
Sold by
Balls Kent M and Balls Wendy M
Bought by
Hayde Park City
Purchase Details
Closed on
Apr 30, 2019
Sold by
Balls Kent M and Balls Wendy M
Bought by
Hyde Park City
Purchase Details
Closed on
Aug 13, 2013
Sold by
Balls Beatrice
Bought by
Balls Kent M and Balls Wendy M
Create a Home Valuation Report for This Property
The Home Valuation Report is an in-depth analysis detailing your home's value as well as a comparison with similar homes in the area
Home Values in the Area
Average Home Value in this Area
Purchase History
| Date | Buyer | Sale Price | Title Company |
|---|---|---|---|
| Kent And Wendy Balls Trust | -- | Northern Title | |
| Balls Kent Marsden | -- | Northern Title | |
| Balls Kent Marsden | -- | Northern Title | |
| Kent And Wendy Balls Trust | -- | -- | |
| Kent And Wendy Balls Trust | -- | None Listed On Document | |
| Kent And Wendy Balls Trust | -- | -- | |
| Kent And Wendy Balls Trust | -- | None Listed On Document | |
| Hayde Park City | -- | None Available | |
| Hyde Park City | -- | None Available | |
| Balls Kent M | -- | Northern Title Company |
Source: Public Records
Mortgage History
| Date | Status | Borrower | Loan Amount |
|---|---|---|---|
| Open | Balls Kent Marsden | $626,000 | |
| Closed | Balls Kent Marsden | $626,000 |
Source: Public Records
Tax History Compared to Growth
Tax History
| Year | Tax Paid | Tax Assessment Tax Assessment Total Assessment is a certain percentage of the fair market value that is determined by local assessors to be the total taxable value of land and additions on the property. | Land | Improvement |
|---|---|---|---|---|
| 2024 | $344 | $437,910 | $0 | $0 |
| 2023 | $3,242 | $392,125 | $0 | $0 |
| 2022 | $3,372 | $392,125 | $0 | $0 |
| 2021 | $2,691 | $480,100 | $126,500 | $353,600 |
| 2020 | $2,621 | $443,784 | $126,500 | $317,284 |
| 2019 | $2,784 | $445,784 | $128,500 | $317,284 |
| 2018 | $2,307 | $366,290 | $83,000 | $283,290 |
| 2017 | $2,323 | $197,640 | $0 | $0 |
| 2016 | $2,356 | $168,600 | $0 | $0 |
| 2015 | $1,989 | $168,600 | $0 | $0 |
| 2014 | $1,938 | $168,600 | $0 | $0 |
Source: Public Records
Map
Nearby Homes
- 258 W 550 S
- 2700 N 300 E
- 76 W 200 S
- 164 E 200 S
- 400 W 3100 N
- 275 W 60 S
- 2807 N Main St
- 646 E 2475 N
- 395 W 3200 N
- 400 W 3200 N
- 684 E 2475 N
- 162 E 2480 N
- 2070 U S 91
- 650 E 2450 N
- 2951 N 1200 E
- 3700 U S 91
- 460 E 85 S
- Northfield Plan at Smiling H Ranch
- Somerley Plan at Smiling H Ranch
- Xavier Plan at Smiling H Ranch