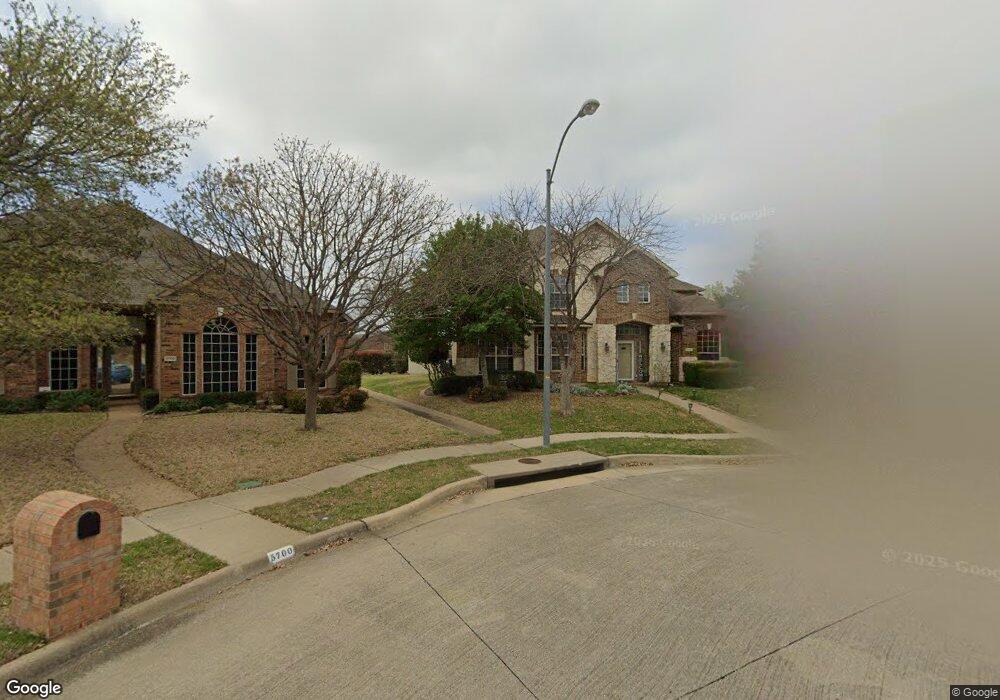
5701 Kettering Ct Richardson, TX 75082
Breckinridge NeighborhoodEstimated Value: $665,000 - $773,000
5
Beds
4
Baths
4,137
Sq Ft
$172/Sq Ft
Est. Value
About This Home
This home is located at 5701 Kettering Ct, Richardson, TX 75082 and is currently estimated at $711,014, approximately $171 per square foot. 5701 Kettering Ct is a home located in Collin County with nearby schools including Miller Elementary School, Murphy Middle School, and C A Mcmillen High School.
Ownership History
Date
Name
Owned For
Owner Type
Purchase Details
Closed on
May 10, 2019
Sold by
Aleksa Jonas V and Aleksa Diane M
Bought by
Rodriguez David and Rodriguez Vanessa M
Current Estimated Value
Home Financials for this Owner
Home Financials are based on the most recent Mortgage that was taken out on this home.
Original Mortgage
$352,500
Outstanding Balance
$228,839
Interest Rate
4%
Mortgage Type
New Conventional
Estimated Equity
$482,175
Purchase Details
Closed on
Sep 30, 2015
Sold by
Carlson David A and Carlson Allison G
Bought by
Aleksa Jonas and Aleksa Diane M
Home Financials for this Owner
Home Financials are based on the most recent Mortgage that was taken out on this home.
Original Mortgage
$220,000
Interest Rate
3.93%
Mortgage Type
New Conventional
Purchase Details
Closed on
Jun 15, 1999
Sold by
Centex International Inc
Bought by
Carslon David A
Home Financials for this Owner
Home Financials are based on the most recent Mortgage that was taken out on this home.
Original Mortgage
$142,850
Interest Rate
7.02%
Mortgage Type
Balloon
Create a Home Valuation Report for This Property
The Home Valuation Report is an in-depth analysis detailing your home's value as well as a comparison with similar homes in the area
Home Values in the Area
Average Home Value in this Area
Purchase History
| Date | Buyer | Sale Price | Title Company |
|---|---|---|---|
| Rodriguez David | -- | Stewart Title | |
| Aleksa Jonas | -- | Allegiance Title Co | |
| Carslon David A | -- | -- |
Source: Public Records
Mortgage History
| Date | Status | Borrower | Loan Amount |
|---|---|---|---|
| Open | Rodriguez David | $352,500 | |
| Previous Owner | Aleksa Jonas | $220,000 | |
| Previous Owner | Carslon David A | $142,850 |
Source: Public Records
Tax History Compared to Growth
Tax History
| Year | Tax Paid | Tax Assessment Tax Assessment Total Assessment is a certain percentage of the fair market value that is determined by local assessors to be the total taxable value of land and additions on the property. | Land | Improvement |
|---|---|---|---|---|
| 2025 | $10,174 | $689,591 | $178,125 | $522,694 |
| 2024 | $10,174 | $626,901 | $156,250 | $529,186 |
| 2023 | $10,174 | $569,910 | $156,250 | $513,245 |
| 2022 | $10,644 | $518,100 | $150,000 | $451,655 |
| 2021 | $10,292 | $471,000 | $112,500 | $358,500 |
| 2020 | $9,873 | $445,000 | $100,000 | $345,000 |
| 2019 | $10,892 | $468,255 | $100,000 | $368,255 |
| 2018 | $10,528 | $450,653 | $100,000 | $350,653 |
| 2017 | $9,873 | $422,607 | $87,500 | $335,107 |
| 2016 | $9,444 | $401,211 | $75,000 | $326,211 |
| 2015 | $7,323 | $356,134 | $75,000 | $281,134 |
Source: Public Records
Map
Nearby Homes
- 3203 Grantham Dr
- 5517 Enfield Dr
- 3309 Grantham Dr
- 3041 Hillingdon Dr
- 2720 Ranchview Dr
- 2988 Hillingdon Dr
- 179 Moonlight Dr
- 403 Pleasant Run
- 18 Kilchurn
- 3624 Connaught Rd
- 3613 Gloucester Rd
- 524 Jasmine Dr
- 5413 Carrington Dr
- 2603 Grant Dr
- 7022 Cottonwood Cir
- 7319 Crane Dr
- 7307 Crane Dr
- 1201 Tralee Ln
- 7010 Cottonwood Cir
- 5421 Palace Dr
- 5705 Kettering Ct
- 5700 Kettering Ct
- 5704 Wilmington Ct
- 5700 Wilmington Ct
- 5709 Kettering Ct
- 5704 Kettering Ct
- 5708 Kettering Ct
- 5708 Wilmington Ct
- 5713 Kettering Ct
- 5701 Wilmington Ct
- 5712 Wilmington Ct
- 5712 Kettering Ct
- 5705 Wilmington Ct
- 5709 Wilmington Ct
- 5711 Baskerville Dr
- 5709 Baskerville Dr
- 5701 Baskerville Dr
- 5713 Baskerville Dr
- 5707 Baskerville Dr
- 3016 Grantham Dr