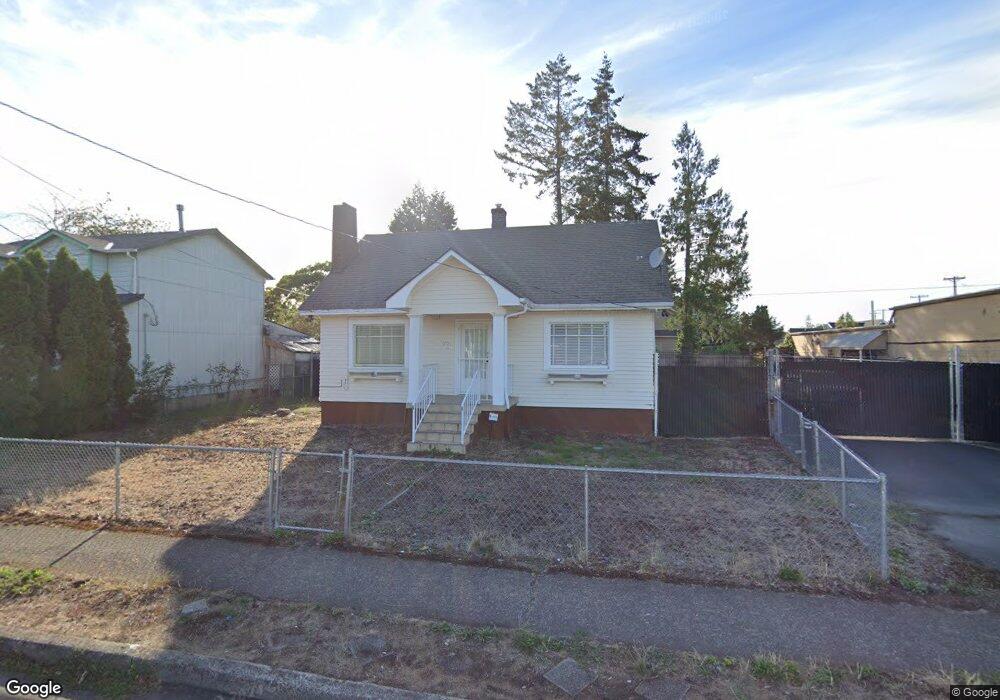
5701 SE 86th Ave Portland, OR 97266
Lents NeighborhoodEstimated Value: $433,000 - $503,000
3
Beds
1
Bath
1,984
Sq Ft
$235/Sq Ft
Est. Value
About This Home
This home is located at 5701 SE 86th Ave, Portland, OR 97266 and is currently estimated at $466,530, approximately $235 per square foot. 5701 SE 86th Ave is a home located in Multnomah County with nearby schools including Woodmere Elementary School, Lane Middle School, and Franklin High School.
Ownership History
Date
Name
Owned For
Owner Type
Purchase Details
Closed on
Aug 20, 2014
Sold by
Vanvando Hoc Van
Bought by
Georges Danae
Current Estimated Value
Purchase Details
Closed on
Jul 20, 2009
Sold by
Us Bank National Association
Bought by
Vando Hoc and Le Vi Tuong
Purchase Details
Closed on
Jan 23, 2009
Sold by
Abot Soleta
Bought by
Lasalle Bank Na and Mlmi Trust Series 2007-Sd1
Purchase Details
Closed on
Nov 14, 2006
Sold by
Nemarundwe Appel J
Bought by
Abot Soleta
Home Financials for this Owner
Home Financials are based on the most recent Mortgage that was taken out on this home.
Original Mortgage
$244,000
Interest Rate
8.32%
Mortgage Type
Balloon
Purchase Details
Closed on
Dec 7, 2005
Sold by
Stephens Campbell Lori Lynn
Bought by
Nemarundwe Appel J
Home Financials for this Owner
Home Financials are based on the most recent Mortgage that was taken out on this home.
Original Mortgage
$196,000
Interest Rate
8.37%
Mortgage Type
Balloon
Create a Home Valuation Report for This Property
The Home Valuation Report is an in-depth analysis detailing your home's value as well as a comparison with similar homes in the area
Home Values in the Area
Average Home Value in this Area
Purchase History
| Date | Buyer | Sale Price | Title Company |
|---|---|---|---|
| Georges Danae | $250,000 | First American | |
| Vando Hoc | $124,500 | Fidelity Natl Title Co Of Or | |
| Lasalle Bank Na | $151,910 | Fidelity National Title Co | |
| Abot Soleta | $305,000 | Lawyers Title Ins | |
| Nemarundwe Appel J | $245,000 | Lawyers Title Ins |
Source: Public Records
Mortgage History
| Date | Status | Borrower | Loan Amount |
|---|---|---|---|
| Previous Owner | Abot Soleta | $244,000 | |
| Previous Owner | Nemarundwe Appel J | $196,000 |
Source: Public Records
Tax History Compared to Growth
Tax History
| Year | Tax Paid | Tax Assessment Tax Assessment Total Assessment is a certain percentage of the fair market value that is determined by local assessors to be the total taxable value of land and additions on the property. | Land | Improvement |
|---|---|---|---|---|
| 2024 | $6,656 | $248,780 | -- | -- |
| 2023 | $6,400 | $241,540 | $0 | $0 |
| 2022 | $6,262 | $234,510 | $0 | $0 |
| 2021 | $6,156 | $227,680 | $0 | $0 |
| 2020 | $5,647 | $221,050 | $0 | $0 |
| 2019 | $5,440 | $214,620 | $0 | $0 |
| 2018 | $5,280 | $208,370 | $0 | $0 |
| 2017 | $5,060 | $202,310 | $0 | $0 |
| 2016 | $4,631 | $196,420 | $0 | $0 |
| 2015 | $4,481 | $190,700 | $0 | $0 |
| 2014 | $3,735 | $185,150 | $0 | $0 |
Source: Public Records
Map
Nearby Homes
- 5913 SE 86th Ave
- 5724 SE 83rd Ave Unit 5726
- 5628 SE 87th Ave
- 6024 SE 84th Place
- 5636 SE 88th Ave
- 8819 SE Ellis St Unit 5
- 6126 SE 86th Ave
- 8503 SE Insley St Unit 8521
- 8413 SE Insley St
- 6131 SE 87th Ave
- 5843 SE 90th Ave
- 6103 SE 83rd Ave
- 5506 SE 89th Ave
- 6336 SE 84th Place
- 5829 SE 80th Ct Unit 5831
- 6331 SE 83rd Ave
- 6010 SE 91st Ave
- 6412 SE 83rd Ave
- 6524 SE 86th Ave
- 8632 SE Liebe St
- 5707 SE 86th Ave
- 8530 SE Foster Rd
- 5715 SE 86th Ave
- 5650 SE 85th Ave
- 5646 SE 85th Ave
- 5723 SE 86th Ave
- 5710 SE 85th Ave
- 5716 SE 85th Ave
- 8506 SE Foster Rd
- 5727 SE 86th Ave
- 5720 SE 85th Ave Unit 5722
- 8533 SE Foster Rd
- 5733 SE 86th Ave
- 5622 SE 86th Ave
- 5736 SE 85th Ave
- 5651 SE 85th Ave
- 5610 SE 86th Ave Unit 5614
- 5711 SE 85th Ave
- SE 86th Ave
- 5736 SE 86th Ave