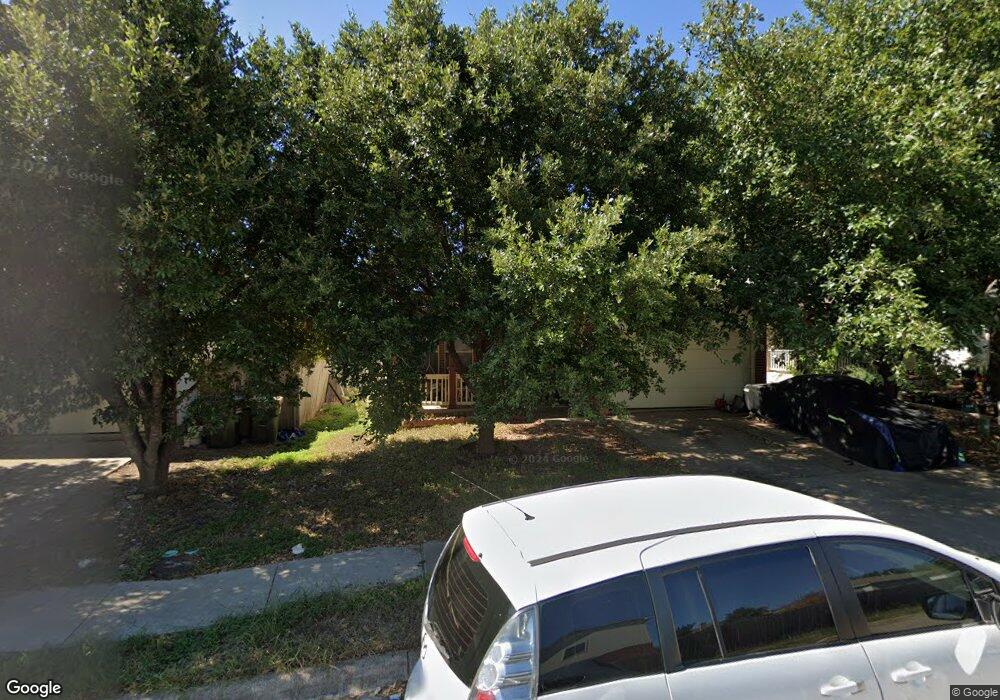
5702 Netleaf Rd Austin, TX 78724
Hornsby Bend NeighborhoodEstimated Value: $244,971 - $277,000
3
Beds
2
Baths
1,326
Sq Ft
$199/Sq Ft
Est. Value
About This Home
This home is located at 5702 Netleaf Rd, Austin, TX 78724 and is currently estimated at $263,243, approximately $198 per square foot. 5702 Netleaf Rd is a home located in Travis County with nearby schools including Joseph Gilbert Elementary School, Dailey Middle School, and Del Valle High School.
Ownership History
Date
Name
Owned For
Owner Type
Purchase Details
Closed on
Feb 10, 2010
Sold by
Secretary Of Housing & Urban Development
Bought by
Mcnulty David and Mcnulty Shelby
Current Estimated Value
Home Financials for this Owner
Home Financials are based on the most recent Mortgage that was taken out on this home.
Original Mortgage
$66,500
Interest Rate
5.11%
Mortgage Type
Purchase Money Mortgage
Purchase Details
Closed on
Sep 15, 2009
Sold by
National City Bank
Bought by
The Secretary Of Housing & Urban Develop
Purchase Details
Closed on
Sep 1, 2009
Sold by
Palacios Eloina and Palacios Luis
Bought by
National City Bank
Purchase Details
Closed on
Jul 29, 2004
Sold by
Main Street Ltd
Bought by
Palacios Luis
Home Financials for this Owner
Home Financials are based on the most recent Mortgage that was taken out on this home.
Original Mortgage
$105,186
Interest Rate
6.26%
Mortgage Type
FHA
Create a Home Valuation Report for This Property
The Home Valuation Report is an in-depth analysis detailing your home's value as well as a comparison with similar homes in the area
Home Values in the Area
Average Home Value in this Area
Purchase History
| Date | Buyer | Sale Price | Title Company |
|---|---|---|---|
| Mcnulty David | -- | None Available | |
| The Secretary Of Housing & Urban Develop | -- | None Available | |
| National City Bank | $100,434 | None Available | |
| Palacios Luis | -- | Fidelity National Title |
Source: Public Records
Mortgage History
| Date | Status | Borrower | Loan Amount |
|---|---|---|---|
| Closed | Mcnulty David | $66,500 | |
| Previous Owner | Palacios Luis | $105,186 |
Source: Public Records
Tax History
| Year | Tax Paid | Tax Assessment Tax Assessment Total Assessment is a certain percentage of the fair market value that is determined by local assessors to be the total taxable value of land and additions on the property. | Land | Improvement |
|---|---|---|---|---|
| 2025 | $3,758 | $228,271 | $77,680 | $150,591 |
| 2023 | $3,710 | $231,179 | $40,000 | $191,179 |
| 2022 | $5,170 | $287,166 | $40,000 | $247,166 |
| 2021 | $3,352 | $178,700 | $40,000 | $138,700 |
| 2020 | $3,019 | $151,724 | $40,000 | $111,724 |
| 2018 | $3,304 | $154,597 | $40,000 | $114,597 |
| 2017 | $3,205 | $144,600 | $22,000 | $122,600 |
| 2016 | $2,724 | $122,894 | $22,000 | $100,894 |
| 2015 | $1,792 | $101,493 | $22,000 | $79,493 |
| 2014 | $1,792 | $96,266 | $22,000 | $74,266 |
Source: Public Records
Map
Nearby Homes
- 14902 Nuttall Dr
- 15009 Mossycup Ln
- 15102 Mimebark Way
- 5501 English Ave
- 13810 Farm To Market 969
- 13517 Brahmin Dr
- 5805 Berriweather Dr
- 5904 Berriweather Dr
- 6109 Brocade Dr
- 5904 Jacqueline Ln
- 5920 Montrelia Dr
- 6008 Montrelia Dr
- 6005 Shanjia Dr
- 6013 Shanjia Dr
- 6320 Diamondleaf Bend
- 5805 Brampton Ln
- 6120 Shanjia Dr
- 13001 Brahmin Dr
- 4700 Fallenash Dr
- 4700 Castleman Dr
- 5700 Netleaf Rd
- 5704 Netleaf Rd
- 5612 Netleaf Rd
- 5706 Netleaf Rd
- 14900 Mossycup Ln
- 5708 Netleaf Rd
- 5610 Netleaf Rd
- 14901 Nuttall Dr
- 5608 Netleaf Rd
- 14902 Mossycup Ln
- 14901 Mossycup Ln
- 5710 Netleaf Rd
- 14903 Nuttall Dr
- 5606 Netleaf Rd
- 14904 Mossycup Ln
- 14905 Nuttall Dr
- 14905 Mossycup Ln
- 5712 Netleaf Rd
- 14906 Mossycup Ln
- 5604 Netleaf Rd
Your Personal Tour Guide
Ask me questions while you tour the home.