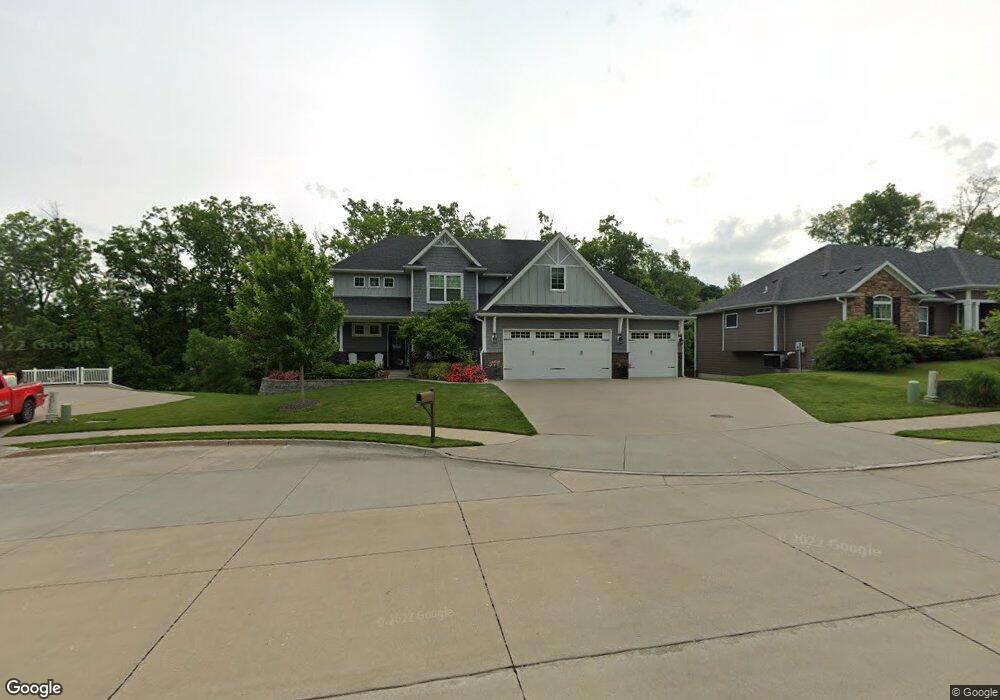
5702 Shackelford Ct Columbia, MO 65203
Estimated Value: $661,000 - $933,000
5
Beds
4
Baths
2,746
Sq Ft
$269/Sq Ft
Est. Value
About This Home
This home is located at 5702 Shackelford Ct, Columbia, MO 65203 and is currently estimated at $738,822, approximately $269 per square foot. 5702 Shackelford Ct is a home located in Boone County with nearby schools including Beulah Ralph Elementary School, Ann Hawkins Gentry Middle School, and Rock Bridge High School.
Ownership History
Date
Name
Owned For
Owner Type
Purchase Details
Closed on
Mar 10, 2021
Sold by
Korman Bradley A and Korman Erin B
Bought by
Korman Bradley A and Korman Erin B
Current Estimated Value
Purchase Details
Closed on
May 11, 2015
Sold by
Beacon Street Properties Llc
Bought by
Korman Bradley A and Swift Erin B
Home Financials for this Owner
Home Financials are based on the most recent Mortgage that was taken out on this home.
Original Mortgage
$366,300
Outstanding Balance
$282,797
Interest Rate
3.74%
Mortgage Type
New Conventional
Estimated Equity
$456,025
Purchase Details
Closed on
Nov 20, 2013
Sold by
The Columbia Development Group Llc
Bought by
Beacon Street Properties Llc
Home Financials for this Owner
Home Financials are based on the most recent Mortgage that was taken out on this home.
Original Mortgage
$374,060
Interest Rate
4.29%
Mortgage Type
Construction
Create a Home Valuation Report for This Property
The Home Valuation Report is an in-depth analysis detailing your home's value as well as a comparison with similar homes in the area
Home Values in the Area
Average Home Value in this Area
Purchase History
| Date | Buyer | Sale Price | Title Company |
|---|---|---|---|
| Korman Bradley A | -- | None Available | |
| Korman Bradley A | -- | Boone Central Title Co | |
| Beacon Street Properties Llc | -- | Boone Central Title Company |
Source: Public Records
Mortgage History
| Date | Status | Borrower | Loan Amount |
|---|---|---|---|
| Open | Korman Bradley A | $366,300 | |
| Previous Owner | Beacon Street Properties Llc | $374,060 |
Source: Public Records
Tax History Compared to Growth
Tax History
| Year | Tax Paid | Tax Assessment Tax Assessment Total Assessment is a certain percentage of the fair market value that is determined by local assessors to be the total taxable value of land and additions on the property. | Land | Improvement |
|---|---|---|---|---|
| 2025 | $5,077 | $86,165 | $15,162 | $71,003 |
| 2024 | $5,077 | $75,259 | $15,162 | $60,097 |
| 2023 | $5,035 | $75,259 | $15,162 | $60,097 |
| 2022 | $4,837 | $72,371 | $15,162 | $57,209 |
| 2021 | $4,846 | $72,371 | $15,162 | $57,209 |
| 2020 | $5,157 | $72,371 | $15,162 | $57,209 |
| 2019 | $5,157 | $72,371 | $15,162 | $57,209 |
| 2018 | $5,193 | $0 | $0 | $0 |
| 2017 | $5,131 | $72,371 | $15,162 | $57,209 |
| 2016 | $4,721 | $66,709 | $9,500 | $57,209 |
| 2015 | $4,336 | $66,709 | $9,500 | $57,209 |
| 2014 | -- | $5,700 | $5,700 | $0 |
Source: Public Records
Map
Nearby Homes
- 5302 Steeplechase Dr
- 5204 Newbury Way
- 5809 Morning Star Ct
- 5108 Newbury Way
- 5437 Steeplechase Dr
- 5431 Steeplechase Dr
- 5961 S Highway Kk
- 6000 S Highway Kk
- 4803 Center Brook Ct
- 4902 Cochero Ct
- 5203 Regal Way
- 4701 Thornbrook Ridge
- 5004 Regal Ct
- 5405 Chamois Dr
- 5303 Chamois Dr
- 4609 Sawgrass Dr
- 4530 Stonington Ct
- 4522 Stonington Ct
- 4518 Stonington Ct
- 4105 Astoria Way
- 5702 Shackelford Ct Unit LOT 209
- 5704 Shackelford Ct
- 5700 Shackleford Ct
- 5700 Shackelford Ct
- 5623 Spicewood Dr Unit LOT 204
- 5623 Spicewood Dr
- 5625 Spicewood Dr
- 5625 Spicewood Dr Unit LOT 205
- 5706 Shackelford Ct Unit LOT 207
- 5706 Shackelford Ct
- 5703 Shackleford Ct
- 5703 Shackelford Ct
- 5705 Shackelford Ct
- 5627 Spicewood Dr Unit LOT 206
- 5627 Spicewood Dr
- 5701 Shackelford Ct
- 5203 Steeplechase Dr
- 5205 Steeplechase Dr
- 5201 Steeplechase Dr
- 5301 Steeplechase Dr