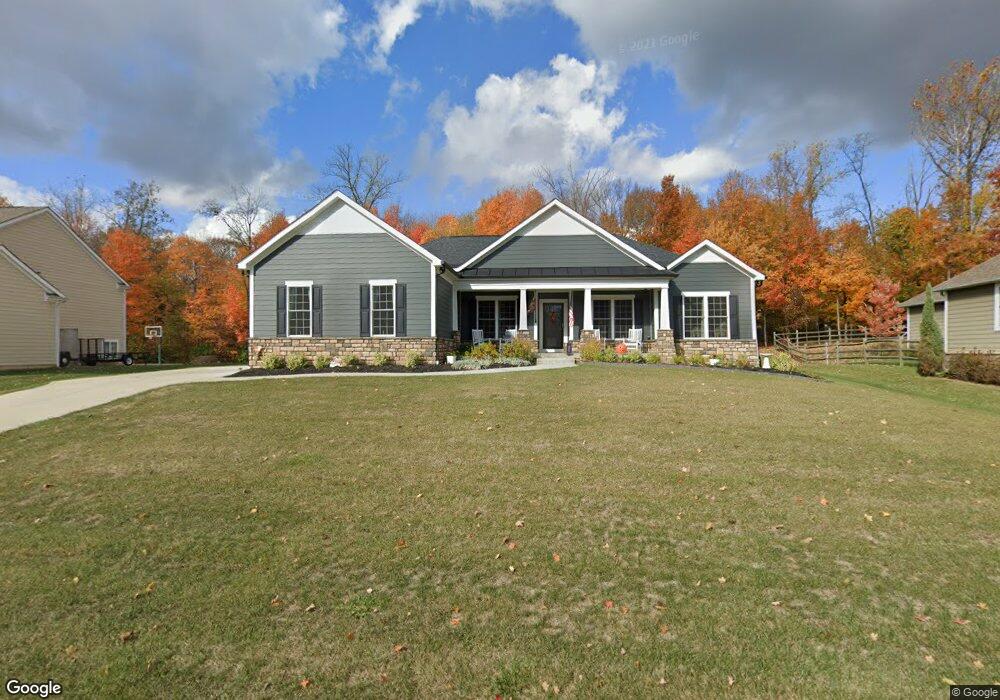
5702 Whispering Ridge Dr Galena, OH 43021
Genoa NeighborhoodEstimated Value: $704,000 - $764,000
4
Beds
3
Baths
3,000
Sq Ft
$243/Sq Ft
Est. Value
About This Home
This home is located at 5702 Whispering Ridge Dr, Galena, OH 43021 and is currently estimated at $728,853, approximately $242 per square foot. 5702 Whispering Ridge Dr is a home located in Delaware County with nearby schools including Walnut Creek Elementary School, Berkshire Middle School, and Orange High School.
Ownership History
Date
Name
Owned For
Owner Type
Purchase Details
Closed on
Apr 25, 2018
Sold by
Hrenko Gary J and Hrenko Susan E
Bought by
Hrenko Trust
Current Estimated Value
Purchase Details
Closed on
Jul 18, 2014
Sold by
Seeds Todd W and Seeds Deborah L
Bought by
Hrenko Gary J and Hrenko Susan E
Purchase Details
Closed on
Sep 15, 2006
Sold by
Lam Duyen
Bought by
Seeds Todd W and Seeds Deborah L
Home Financials for this Owner
Home Financials are based on the most recent Mortgage that was taken out on this home.
Original Mortgage
$70,000
Interest Rate
6.75%
Mortgage Type
Purchase Money Mortgage
Purchase Details
Closed on
May 26, 2006
Sold by
The Bigler Co Ltd
Bought by
Lam Duyen
Home Financials for this Owner
Home Financials are based on the most recent Mortgage that was taken out on this home.
Original Mortgage
$260,000
Interest Rate
6.68%
Mortgage Type
Construction
Create a Home Valuation Report for This Property
The Home Valuation Report is an in-depth analysis detailing your home's value as well as a comparison with similar homes in the area
Home Values in the Area
Average Home Value in this Area
Purchase History
| Date | Buyer | Sale Price | Title Company |
|---|---|---|---|
| Hrenko Trust | -- | -- | |
| Hrenko Gary J | $65,000 | Northwest Select Title Agenc | |
| Seeds Todd W | $70,000 | Tradition Title Agency | |
| Lam Duyen | $72,000 | Crown Title |
Source: Public Records
Mortgage History
| Date | Status | Borrower | Loan Amount |
|---|---|---|---|
| Previous Owner | Seeds Todd W | $70,000 | |
| Previous Owner | Lam Duyen | $260,000 |
Source: Public Records
Tax History Compared to Growth
Tax History
| Year | Tax Paid | Tax Assessment Tax Assessment Total Assessment is a certain percentage of the fair market value that is determined by local assessors to be the total taxable value of land and additions on the property. | Land | Improvement |
|---|---|---|---|---|
| 2024 | $12,902 | $233,210 | $38,680 | $194,530 |
| 2023 | $12,949 | $233,210 | $38,680 | $194,530 |
| 2022 | $10,629 | $155,580 | $29,750 | $125,830 |
| 2021 | $10,689 | $155,580 | $29,750 | $125,830 |
| 2020 | $10,740 | $155,580 | $29,750 | $125,830 |
| 2019 | $9,962 | $149,590 | $29,750 | $119,840 |
| 2018 | $10,259 | $149,590 | $29,750 | $119,840 |
| 2017 | $6,452 | $136,500 | $28,560 | $107,940 |
| 2016 | $9,969 | $136,500 | $28,560 | $107,940 |
| 2015 | $2,753 | $40,810 | $28,560 | $12,250 |
| 2014 | $981 | $14,000 | $14,000 | $0 |
| 2013 | $1,003 | $14,000 | $14,000 | $0 |
Source: Public Records
Map
Nearby Homes
- 4548 Big Walnut Rd
- 6356 Tournament Dr
- 5557 Edgebrook Dr
- 4585 McAlister Park Dr
- 6061 Highland Hills Dr
- 4320 McAlister Park Dr
- 5694 Piermont Ct
- 4367 McAlister Park Dr
- 4790 Sanctuary Dr
- 5731 Salem Dr
- The Chatham Plan at The Nook at Highland Lakes
- The Bentley Plan at The Nook at Highland Lakes
- The Lexington Plan at The Nook at Highland Lakes
- The Dunham Plan at The Nook at Highland Lakes
- The Manchester Plan at The Nook at Highland Lakes
- The Barrington Plan at The Nook at Highland Lakes
- The Ellington Plan at The Nook at Highland Lakes
- The Pembrook Plan at The Nook at Highland Lakes
- The Taft Plan at The Nook at Highland Lakes
- The Starr Plan at The Nook at Highland Lakes
- 5720 Whispering Ridge Dr
- 5720 Whispering Ridge Dr Unit W6381
- 5684 Whispering Ridge Dr
- 5699 Whispering Ridge Dr
- 5719 Whispering Ridge Dr
- 5668 Whispering Ridge Dr
- 5677 Whispering Ridge Dr
- 5742 Whispering Ridge Dr
- 5650 Whispering Ridge Dr
- 5751 Whispering Ridge Dr
- 5760 Whispering Ridge Dr
- 5632 Whispering Ridge Dr
- 5633 Whispering Ridge Dr
- 5775 Whispering Ridge Dr
- 5780 Whispering Ridge Dr
- 5614 Whispering Ridge Dr
- 5611 Whispering Ridge Dr
- 5698 Whispering Trail
- 5716 Whispering Trail
- 5796 Whispering Ridge Dr